How I (Anyone can) Make Money in The Market
— My Simple Two-by-Four Approach —
My simple 2-by-4 Trading and Investing Methodology
introduces two goals and four rules.
First let me say that we need to always think like an investor
but understand that every investment begins and ends with a trade.
We want to master the mechanics of trading to better achieve our investment objectives.
Notice:
This paper is targeted at those who are willing to work for an above average rate of return.
If you'd prefer to spend your time on alternative activities and
are happy to earn the basic market rate of return,
stop here and just
Dollar-Cost Average (DCA) into
one (or two dissimilar) traditional index fund(s) like
Vanguard's Total U.S. Stock Market Index Fund
VTSAX (the traditional version) or
VTI (the ETF version).
Start with just one of these two stock funds.
In time, you might want to also add a Total U.S. Bond Market Index fund like,
Vanguard's
VBTLX or
BND
using a 60% Stocks and 40% Bonds
Asset Allocation
with a quarterly rebalance or whenever the divergence exceeds 5%
(e.g., stocks go to 65% and bonds drop to 35%).
Just DCA into retirement.
It is best to save as much as you can.
Trust me, in retirement you'll probably wish you had saved more.
Once you've reached your Financial Freedom Number,
just DCA back out, taking what you need to cover your expenses.
This simple and dependable approach allows you to take advantage of our (U.S.) economic system to save for retirement,
which assumes that the future will tend to resemble the past,
which I think is a reasonably safe assumption.
However, if you are willing to work for an above average rate of return (or are at least curious), read on...
The following summary information is based on my experience
in the market for tradable securities.
The following also assumes that you have an appropriately funded brokerage account and
know how to enter a Limit Order
to request a trade.
But you need help to make those savings grow to meet your future needs.
To that end,
I have two goals: A primary and a secondary;
and a set of four rules that make it much easier to be successful on Wall Street,
a market for tradable securities that is open to anybody with time and money to investment.
- The Primary Goal is to Be Consistently Profitable to Realize a Positive Compound Growth Rate.
- The Secondary Goal is to Improve your Rate of Return after becoming Consistently Profitable.
Our Primary and Secondary Goals require us to earn money at the best rate of return the market and our skills permit.
Learn, and in time master, the following rules and you too will be able to achieve these two goals.
- Be about the Business of Growing Your Wealth.
- Focus on a few Dissimilar Survivable Investments that Pay you to Hold.
- Trade like a Professional Value Investor.
- Keep your Operations In-Sync with the Health of the Broader-Market Trend.
— When starting out, Keep it Simple —
When you first start out,
just focus on the
Primary Objective
and the essence of the first three Rules,
which empower
the ability to achieve that goal.
Some of the information on this web page can be a bit technical and may be a little overwhelming,
so in this section I offer up a simpler version of my (maybe not so) simple 2X4 approach.
From Rule #1,
write down (track) your investment
Cost Basis
(a.k.a., your break-even price).
This is the amount paid to get into an investment
and if you buy more of that investment,
you'll need to revise the investment cost basis.
In fact, every trade requires an accounting update*.
We need to track the basis for each atomic buy, the whole position, and were beneficial, any combination therein.
Note that the IRS says that you are free to
sell in any beneficial order or combination
so long as you report that to your broker,
who's required to report the details to the IRS.
We do this to periodically compare our cost-basis (break-even price) to current market prices
(current trading opportunities)
to understand and manage our Profit & Loss (P&L).
Please understand that Mr. Market's prices trade up and down over-and-over again,
which gives us lots of opportunities to repeatedly buy low and sell at some higher prices.
We just need to be patient and methodical.
Mr. Market can show you some very large price swings,
if you'll just be patient.
He'll also give you lots of opportunity to
make quicker but smaller profits
if you are willing to methodically work
a process like this that has favorable odds of yielding a positive rate of return,
which is the essence of Rule #1.
Maintaining a good set of trading records is the first part of
Rule #1.
The second part requires that we employ a simple repetitive process.
Periodically, like once a day, week or whenever you can,
use current market prices to compare those against your trading records
to see if any of your prior buy(s) are in-the-money
(i.e., showing you a momentary acceptable and preferably above average profit).
With each periodic iteration ask the question,
"Is now better to buy, sell, or wait for better prices?"
If market prices are up,
above your basis,
consider selling some or all to lock-in a positive rate of return
and to free up some cash to buy back-in at some lower future price.
If prices are down,
consider buying more;
but make each additional commitment of savings work to pull your basis (break-even price) down
and thus making it easier to realize an acceptable profit on some future up turn.
However,
most of time we'll just need to wait for better prices
and earn those future dividend payments.
Only sell to book acceptable profits.
Don't let Mr. Market scare you out with a loss!
To avoid the need for a Stop-Loss Trade,
we focus on appropriate security selection.
Rule #2
requires that we focus our time and money on a top-quality investment that we can just hold,
preferably a broad-based index fund
like an S&P 500 Index EFT (e.g., ticker symbol SPY)
or Schwab's US Large-Cap ETF (ticker SCHX),
which has a much lower (workable) price tag but with very similar performance characteristics.
Rule #3 requires us to buy-low and sell-high.
But that begs the question, "What's low?"
We'll look at a daily, weekly, and monthly chart set
of our one and only investment
to see what Mr. Market says about the likely fair value price range of the investment
over those timeframes
(i.e., to see the current and prior range of high and low prices,
a trading range that can be projected into the future).
Notice that longer timeframes (e.g., as seen in monthly charts)
have bigger trading ranges than quicker timeframes (e.g., in daily charts).
But the longer timeframes require a lot more patience to live through those bigger price swings.
Whatever timeframe we're trying to work or forced to work,
we (of course) want to buy when prices are in the lower half of that trading range and
to sell when prices are in the upper half.
We'll spend most of our time waiting for lower buy prices and then higher sell prices, over-and-over again,
which is why we prefer investments that'll pay us (e.g., dividends) to hold
(Rule #2).
We can try to make money in quicker timeframes,
which is harder to do,
and rely on slower (bigger) timeframes
when we must to realize our
Primary Objective.
Take comfort in the knowledge that,
when it comes to a broad-based index investment like this,
most future prices are very likely to remain within the broader uptrending trading range
as seen on a ten-year or longer monthly chart
and that making money is mostly a function of economic growth.
This type of investment always gives us the option to just hold and earn that next dividend,
while we develop the ability to earn acceptable capital gain profits from the various price swings we see going forward.
Timing the next market bottom or top is hard,
but we don't need to do that to achieve our Primary Goal.
Furthermore, we need to be in it to win it
(i.e., we need at least a little market exposure to realize our next profit).
We can use a limit order to target a buy in the lower half or at least the middle of the current trading range
as seen on a daily chart over the prior year or so.
(If this chart reading exercise seems to be too much,
just buy a little at current prices, continue reading,
and continue looking at the chart set —
in time, your brain will develop the ability to see
favorable trading opportunities,
the repeating chart patterns I'm talking about in this memo.)
If you have enough savings to buy more than just a few shares,
break up your buying power into smaller portions and use that to scale in and out
as market prices naturally swing (trend) up and down over-and-over again,
otherwise just use new savings to only buy more at lower prices.
Please note that you don't need to master the
Analysis
to become consistently profitable.
These occasional profits and dividends will allow you to achieve our primary goal of being a CPT.
Once you've started,
it's this iterative process from (the essence of) these three rules that allows you to become consistently profitable.
Learn to profitably work the market you see
by taking a little profit out of every price swing you can
as market prices trade up and down in the current and broader trading ranges
as seen on the evolving daily, weekly, and monthly charts.
Once you've realized true CPT status
(i.e., you are consistently profitable and enjoy a positive compound growth rate),
consider adding another (different) ETF and work on your
Analytical Skills,
your ability to see favorable trading opportunities,
and on your iterative business process to earn the best rate of return possible from the various price swings you see.
Given an effective application of these simple rules,
being a successful investor is mostly about being paid to wait on and work an appropriate investment.
We're all either waiting for Mr. Market to show us a good entry or exit price
to yield our next capital gain or to pay our next dividend for owning an investment
that can offer up favorable trading opportunities over-and-over again.
Be patient, focused, and methodical.
An adequate mastery of the following information will allow us to achieve both our
Primary
and maybe our
Secondary
Objectives.
— Driving Assumptions —
My simple 2X4 approach is based on the following assumptions,
which were derived from my three plus decades of experience in saving, trading, and investing for retirement.
-
A positive compound growth rate is the easiest way to become rich,
to realize the nest egg required to fund a comfortable retirement, and
to save for other expensive purchases, like an education for a child.
We all want to get rich quickly.
It is human nature to think,
"I just need a hot stock tip, a piece of the next hot investment or a winning lottery ticket."
But this almost never works; and
when it does work, that quick gain is often returned attempting to reproduce that rare achievement.
However,
It is not that hard to save a little from each paycheck,
expose those savings to a positive rate of return
(a compound growth rate), and
then patiently and persistently repeating this simple process over many years.
This simple approach can make anyone rich or at least a lot richer,
and it quietly happens over-and-over again in the Wall Street market for tradable securities.
We almost never hear this boring story from the popular financial media,
which make their living on feeding us stories (dreams) about how we can get rich quickly.
It is time to grow up and earn our rich rewards one doable profit reinvested over-and-over again.
Slow and steady wins this race and anyone can do it.
-
There are basically
just two ways
to make money on Wall Street, and we should use both.
-
Earn a Capital Gain by buying at a price below the selling price,
which drives the adage, "Buy Low and Sell High".
Note that there are three ways to realize higher prices.
1) Normal economic growth,
2) Only start buying at below average prices, and
3) Work to generate a below-average cost basis (our break-even price).
-
Earn income while waiting for your next capital gain. I like to think of this as being paid to hold.
The sum of these two above is called Total Return.
To understand the math, see my Related Notes on this subject.
-
The future tends to resemble the past
and can greatly favor those who can learn from the past.
Chart analysis
is a great way to study historic price behavior,
to understand what is happening now,
and to target future favorable trading opportunities.
Charts allow us to receive the Message of the Market and
leverage the Wisdom of Crowds.
-
All market prices trade up and down in a range that reflects the market's collective view of fair value.
This is true because big investment professionals (portfolio managers) want to buy-low, at discount prices, and to sell-high, at premium prices
based on their superior ability to do a proper fundamental analysis of the securities they've chosen to invest in.
-
Market prices will generally spend most of their time within the broader trading range
as best seen on all monthly and most weekly chart timeframes.
This is generally true because the underlying economics do not change that often or that much.
However, news and commentary can change the market's collective belief about the underlying economics.
This is specifically true for all major market index funds
(e.g., S&P 500)
and generally true for those big, mature business issues
(tradable securities)
that drive these indices up and down.
-
Market prices will trend (move) up, down, and sideways based on the market's collective belief
about likely future economic growth or contraction.
Trending behavior is generally driven by professional traders, the Fast Money.
Professional traders need market prices to move in order for them to make their fast money capital gains,
and that tends to yield market volatility,
which all professionals desire
because they (we) all want to buy low and sell high,
over-and-over again.
Market prices perpetually trade up and down in a trading range that moves with a healthy broader market trend.
-
Healthy market trends are likely to continue,
and unhealthy market trends are likely to stall, retrace, or reverse.
Trend reversals happen when Fast-Money traders drive market prices into the waiting arms of the much bigger investment professionals,
which do their buying at discount prices and their selling at premium prices
and thus define the size of the current trading range.
-
Professional investors understand that
a longer-term average (like in the middle) of a broader trending trading range is a very good indication of likely future value.
Fast money traders have the skill to leverage this wisdom in quicker timeframes.
The pros focus on how market prices tend to react to a standard set of moving averages and prior trading range extremes
(tops and bottoms) to gauge trend health
(we'll take a look at this in Rule #4).
-
Professionals understand that
prices above a longer-term moving average are assumed to be at a premium and below are discount prices.
Purchases below this average and sales above are very likely to yield a superior rate of return.
-
It takes (time and) money to make money in the markets;
and the more we have to invest,
the easier and safer it becomes to make more
with a lower risk of being forced to take a permanent loss of savings.
Please understand that the best quality investments tend to have a higher price tag.
Like in every other aspect of life,
the better the quality the bigger the price tag.
Also note that higher priced securities tend to move about the same percentage as lower priced issues
(i.e., the trading range sizes tend to have similar yields and to verify:
divide the higher-end price by the lower-end price and then subtract one
to get the yield possible in that full trading range,
e.g., $10 / $9 = 1.111 - 1 = 0.111 or 11.1% Vs $100 / $90 = 1.111 or 11.1%);
However, the dollar amount swing is greater for higher priced items
(subtract the lower-end price from the higher-end equals the capital gain possible for the same price swing in that trading range,
e.g., $10 - $9 = $1 Vs $100 - $90 = $10)
and that can make a big difference in your P&L,
especially when you can add some zeros to the trade size
(100 times a $1 of profit is $100 but 1000 time a $1 is $1,000).
Size matters in the market for tradable securities.
But there's a psychological problem with adding size.
When you add size, you also add capital commitment,
and that can add emotional stress,
which is complicated by the fact that all future price moves are uncertain and can be a bit random and whippy over quicker intervals of time.
Professional traders manage this by getting very good at employing a Stop-Loss trade.
But you are probably never going to be a professional trader and learning to master this trade will surely cost you a lot of your savings to realize this fact.
So, focus on being a consistently profitable investor,
work to master My 2X4 Approach
(or in time, your CPT version), and
only increase size slowly after becoming a CPT
to build confidence in your ability to truly manage bigger positions.
-
Much of my Simple 2X4 Approach is based on information in three classic books.
There are many good books on the subject of trading, investing, and financial planning, and I've read as many as I could in my life.
I'd like to suggest that you read and learn as much as you can too.
But there's only a limited amount of time.
So, let's focus on these three that I think do a wonderful job of addressing my three main points,
the essence of the first three rules.
-
The Psychology of Money by Morgan Housel.
We can easily be our own worst enemy on Wall Street and in our personal financial life.
We simply must find the self-disciple to understand and manage our financial affairs,
which requires that we tack our financial details and plan for the future.
You can't effectively manage what you don't understand, and
true understanding requires that we track and study the details with an open mind.
This must be done to manage expectations on the way to achieving our objectives.
-
Winning the Loser's Game by Charles Ellis.
Just own a security that exposes your savings to the whole U.S. stock market (or the biggest and best part, like the S&P 500)
using a Dollar-Cost Averaging strategy.
A broad-based U.S. stock index like this has a lot of internal compound growth.
This investment plus regular savings can get the job done.
This Do It Yourself (DIY) approach is well known to Wall Street and the financial planning industry.
But it is rarely spoken about because there is little opportunity for these pros to get their hands on your money.
Why pay them to do something that we can easily do for ourselves?
-
What Works on Wall Street by James O'Shaughnessy.
All the best strategies in both broader bull and bear markets employ a simple value-based approach
(i.e., be a buyer at below average (discount) prices and a seller at above average (premium) prices).
The very best strategies also employ a focus on investments with positive Relative Straight (RS) relative to their broader market index
(e.g., in a bull market, these securities tend to be the ones that pull their broader market index higher),
but this is an advanced professional tactic,
which assumes that you've mastered the ability to reliably buy low and sell at some higher price over-and-over again
when your primary focus is on an appropriate investment like a broad-based U.S. stock index.
Master this safer index approach first and then consider working one or more of the better issues in that index.
The big take home message is,
when your time and money is focused on a survivable investment that will pay you to hold and
that is likely to show you a higher price sooner or later,
this value-based methodology can yield an above average rate of return.
This simply 2X4 approach has empowered me to reach our Financial Freedom Number
(the amount of money we need to earn every month on average to quit our jobs and live off our savings).
Let's take a closer look at this approach.
— The Primary Goal —
Our primary goal is to have our savings grow to meet our future needs and
to that end we must Commit to being Consistently Profitable to realize a positive compound growth rate,
which is the real wealth creation engine on Wall Street.
There is a ton of hype, get rich quick schemes, and contradictory noise coming from professional Wall Street,
which is very good at transferring wealth from the uninformed, undisciplined, or just lazy to
those professionals that are focused on a methodical process that yields a consistent stream of profits.
Think about.
If these get rich quick strategies could make you (anybody) rich,
then why isn't everybody rich?
Don't be one of the many sheep that fall for these marketing wealth traps
designed to get your money into their hands.
Commit to becoming your own, focused, methodical portfolio manager that can earn a reliable stream of profits
that can make you rich (or a lot richer) over a few decades of compound growth —
slow and steady wins this race.
You can do this,
just Commit to being Consistently Profitable.
Find the self-disciple to avoid all those shiny distractions designed to get more of your savings.
Only expose your time and savings to investments and understandable methods with a
clear track record of success because they are based on compounding a stream of profits
that anybody can earn on Wall Street to meet their future needs.
Our Primary Goal is to be a Consistently Profitable Trader (CPT).
 I know from firsthand experience that the best way to avoid big losses,
generate wealth, and to grow the size of any account is to
commit to being consistently profitable, become a CPT.
A CPT is not someone who never makes a mistake,
never has a losing trade,
nor has an equity drawdown,
as the name might suggest.
A CPT can maintain an average positive rate of return because they can reliably generate more profit than loss.
That is,
they can always put (earn) more profit into their account than they lose in their average Operational Timeframe (OT).
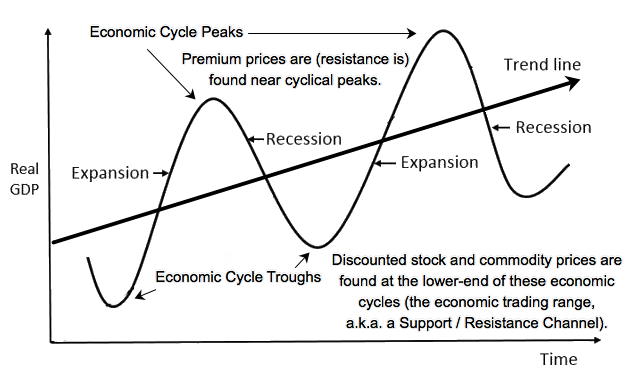
Examples of an OT include an economic boom-bust cycle (as seen in the first chart),
a year, a quarter, a month, a week, or a day;
and can also be any multiple of the prior single examples,
like every six months.
At the start of every OT,
say at the beginning of each month,
start at zero and add all your profits
(i.e., capital gains, dividends, interest, and any other income earned),
then subtract any losses and operating costs.
The result will be your Profit or Loss (P&L) for that interval of time.
Simply put,
the primary goal is to have a profit (a positive rate of return) at the end of every OT.
If you can't do this, try a longer OT, like every 60- or 90-days,
and expand that interval of time until you find an OT that yields CPT status.
Or until you figure out why you are losing so much,
and then stop doing that!
Tracking our monthly P&L is one very good way to keep score
because that has us focus on our profitability.
We can use a twelve-trailing-period average as our true measure of CPT success
as this allows us to employ a rare Stop-Loss trade
that can fortifies returns in a subsequent OT.
Another important way to keep score is to track the growth of our account.
If we were to plot an equity growth curve
(the value of our account over equal measures of time, like at the beginning of every month or quarter),
that line should generally go from the lower left to the upper right on that chart
(from less value to more; and in time, enough value to live on).
Don't be surprised when your account equity chart looks like the economy's boom-bust cycle chart
or whatever securities you choose to invest in.
Initially, most of this growth will come from regular savings,
but in time your CPT operations will do the heavy lifting.
Note that it is easier to earn CPT status in longer OTs.
But in time, everyone should be able earn CPT status in a quarterly timeframe,
which is the cyclical period that all stock companies must report their earnings and
many payout dividends.
Most stock companies do a very workable price cycle up and down within this 90-day window
as best seen in a weekly chart of that ticker.
I know from firsthand experience that the best way to avoid big losses,
generate wealth, and to grow the size of any account is to
commit to being consistently profitable, become a CPT.
A CPT is not someone who never makes a mistake,
never has a losing trade,
nor has an equity drawdown,
as the name might suggest.
A CPT can maintain an average positive rate of return because they can reliably generate more profit than loss.
That is,
they can always put (earn) more profit into their account than they lose in their average Operational Timeframe (OT).
Examples of an OT include an economic boom-bust cycle (as seen in the first chart),
a year, a quarter, a month, a week, or a day;
and can also be any multiple of the prior single examples,
like every six months.
At the start of every OT,
say at the beginning of each month,
start at zero and add all your profits
(i.e., capital gains, dividends, interest, and any other income earned),
then subtract any losses and operating costs.
The result will be your Profit or Loss (P&L) for that interval of time.
Simply put,
the primary goal is to have a profit (a positive rate of return) at the end of every OT.
If you can't do this, try a longer OT, like every 60- or 90-days,
and expand that interval of time until you find an OT that yields CPT status.
Or until you figure out why you are losing so much,
and then stop doing that!
Tracking our monthly P&L is one very good way to keep score
because that has us focus on our profitability.
We can use a twelve-trailing-period average as our true measure of CPT success
as this allows us to employ a rare Stop-Loss trade
that can fortifies returns in a subsequent OT.
Another important way to keep score is to track the growth of our account.
If we were to plot an equity growth curve
(the value of our account over equal measures of time, like at the beginning of every month or quarter),
that line should generally go from the lower left to the upper right on that chart
(from less value to more; and in time, enough value to live on).
Don't be surprised when your account equity chart looks like the economy's boom-bust cycle chart
or whatever securities you choose to invest in.
Initially, most of this growth will come from regular savings,
but in time your CPT operations will do the heavy lifting.
Note that it is easier to earn CPT status in longer OTs.
But in time, everyone should be able earn CPT status in a quarterly timeframe,
which is the cyclical period that all stock companies must report their earnings and
many payout dividends.
Most stock companies do a very workable price cycle up and down within this 90-day window
as best seen in a weekly chart of that ticker.
CPT status is of primary importance because compounding will naturally occur over time
and will magnify whatever trading results we realize over any OT.
A string of profits, no matter how small, will cause our equity growth curve to turn up over time,
a very desirable outcome,
and after many years can allow us to retire in comfort.
But a string of losses (like a string of unnecessary expenditures) can simply hollow out a savings account
and can force you to work in a more traditional job for the rest of your life.
Note that capital losses cause us to not only lose prior savings,
but also the growth in those savings and the time it took to do both.
Capital losses force us to reset our investment clock,
but we can never redo any prior interval of life;
and this is why maintaining CPT status should always be the primary goal.
We simply must commit to avoiding all trades and investments that have
any likely possibility of forcing us to permanently give our money to Mr. Market.
The easiest way to attain and maintain CPT status is to
only take on trades (own investments) that will pay us to hold
and that are likely to yield an acceptable profit sooner or later,
and to simply avoid all other trades that require good luck or skills that we have yet to master.
Do not dismiss the importance of this
Primary Objective.
Anyone who fails to realize and maintain CPT status is
very unlikely to ever realize and maintain real long-term growth on their savings
when exposed to higher yielding market forces.
Cyclically erratic (volatile) market forces allow us to Buy Low and Sell High,
which most people mistakenly assume is the primary goal,
but is in fact too simplistic,
far easier said than done,
and not the only way to achieve and maintain CPT status.
So, our primary goal is to do what we reliably can to increase the size of our account
(i.e., to put money in our account on a regular basis)
by saving on a regular basis and by only doing those things that are likely to yield a positive rate of return.
— The Secondary Goal —
Work to realize your best possible rate of return.
Our Secondary Goal should be to maintain CPT status in our
Optimally Effective Timeframe (OET).
Rate of return is a function of time and ability.
A dollar made in a week has a higher rate of return than a dollar made in two weeks.
Compounding higher rates of return causes our equity curve to turn up sooner and move up quicker.
It is always best to make money as quickly as possible.
But there is a big problem with this secondary objective,
the quicker we try to make a profit,
the harder it becomes and the more likely it will be that we are unable to maintain CPT status,
which can cause our equity curve to turn down.
In fact, way less than 1% of all market participants will ever achieve and maintain daily CPT status,
and that is why most wannabes day-traders get wiped out.
I believe anybody can achieve CPT status over an economic boom-bust cycle,
most can grow to achieve yearly CPT status,
many can even achieve quarterly CPT,
and in time some may be able to achieve monthly CPT status,
if they think like an investor and properly apply the following trading rules.
So, this secondary goal has us keep the bulk of our capital focused on our best OET,
while we use a small percentage to probe the next slightly quicker timeframe
(improve our trading skills).
Once we start to realize CPT status in the next quicker timeframe,
we can then slowly increase the size and number of our positions to yield that higher rate of return,
while we start to probe the next slightly quicker timeframe.
At some point, we will simply be unable to achieve CPT status in the next quicker time,
and the current CPT timeframe will be our Optimally Effective Timeframe,
the best rate of return we're capable of earning.
But please understand that market conditions can change and so can our ability to master new skills.
So, our OET can and will change over time.
We need to adjust accordingly to always earn our best possible rate of return,
which may require us to patiently hold a survivable investment
until Mr. Market is willing to pay us an acceptable profit
that can be re-invested to realize a positive compound growth rate.
Simply stated, make profits quickly
(earn Alpha),
when you can;
and make acceptable profits slowly when you must
(earn Beta,
the market rate of return associated with normal cyclical volatility seen in longer timeframes).
— Rule No. 1 —
Be About the Business of Growing Your Wealth.
This rule is all about having the right mindset and persistently doing those things that are likely to generate prosperity.
It turns out that our lazy, free-spirited nature is our true worst enemy on Wall Street.
We simply must find the self-discipline to develop and execute a repeatable pattern of behavior that can yield a positive compound growth rate.
We simple must treat this effort like a job working for a small business that we own.
Never forget that we're mostly competing with professionals who do this for a living.
But unlike the pros, we don't have to trade every day and in every market environment.
We can pick only good longer-term investments
that'll pay us to hold and that are very likely (sooner-or-later) to show us higher prices.
Given that,
we always have the option to wait for favorable trading opportunities
that are very likely to yield our
Primary Objective
and maybe our
Secondary Objective.
Like all profitable businesses,
we need to maintain a good set of books, our trading records.
This bookkeeping system must empower us to understand our investment details, process, and results.
Furthermore,
to monitor our real-time Profit & Loss (P&L) by comparing our records to current market prices
and current trading opportunities.
So, we can know if we have an acceptable profit to harvest,
an opportunity to buy at lower prices,
or to see that it is best to continue to wait for better prices.
This system must also facilitate an ability to plan for likely future alternatives.
Whenever we buy (invest in) a tradable security,
we need to record (write down) our investment cost basis
(a.k.a., our break-even price, which is also our average price per share).
This is the cost paid to get into the investment
(i.e., the price paid per share plus any trading fees).
For example,
we buy 50 shares of ticker XYZ for $10 per share plus $0
(a free trade, most are now, but not all)
is a $500 investment in that security;
and if we buy more of that investment,
we need to revise the cost basis details.
We need to show (track) the basis for each individual investment,
the whole position,
and maybe any parts therein
(the IRS says that we are free to sell in any order or combination, whichever is best for us).
Continuing our example,
we buy 50 more XYZ at $9 that yields a basis for that individual trade at $450.
We now have 50 shares @ $10, 50 more @ $9 for a total of 100 with an average price/cost of $9.5 per share.
So, any market prices above $9.5 is profitable, assuming little to no selling fees.
This is the first part of this rule.
The second part requires that we employ a simple, repetitive process to monitor our P&L.
Periodically, like once a day, week or whenever we can,
use current market prices to compare those against our trading records (cost basis)
to see if any of our prior buy(s) are either in-the-money or underwater
(i.e., showing us a momentary profit or loss).
Specifically, we need to develop and maintain a Watch-List and an associated iterative analytical and trading methodology.
We want to have a small list of ticker symbols to focus on (specialize in)
and a simple iterative process to:
- Find favorable trading opportunities,
- Plan-out each trade, trade that plan, and then
- Learn from the results.
Having an iterative process with favorable odds of generating more profit than loss is key to success in the markets.
In time, we'll develop a mental mussel memory that'll allow us to quickly spot favorable opportunities and properly act on each.
The pros call this Trading in the Zone.
With each iterative pass,
like once a day, week or month
(or whenever),
look at the broader market environment,
and then analyze each investment (ticker symbol) in our watch-list.
For each ticker, ask "Is it now better to be a buyer, a seller, or to just wait for better prices?"
Don't be surprised if most of the time we're just waiting for better prices,
and that's why we need investments that'll pay us to hold.
This iterative analysis allows us to set and adjust favorable
limit orders,
which are a good way to tell Mr. Market that we're willing to make a trade,
if he'll do that trade at a price that we feel is both possible and favorable to maintaining our
Primary
and
Secondary
Objectives.
Please understand that it is very hard to predict future prices,
but it is not that hard to periodically monitor the current news, commentary, and price action
(which is very quick to factor in the news and commentary)
to decide if it is now better to buy, sell, or continue to wait for better prices.
Every day, and by extension every moment the market is open for trading,
is an opportunity to factor in or ignore new information as just more noise.
Learn to profitably work the market you see.
Favorable trading opportunities will come and go.
If you are paying attention, have some working capital,
and a simple strategy with favorable odds of yielding
an appropriate risk-adjusted profits,
like what I'm suggesting here,
then making money is mostly about showing up and doing the work.
This is a time-tested professional investment technique.
To earn the better rates of return that are possible on Wall Street will require time, money, skill, and effort;
and most importantly, the willingness to patiently and persistently work an iterative process.
So, don't be surprised if all this feels a lot like work.
In time, the work gets easier because it will become second nature.
Furthermore, this type of work can get you retired sooner
and can be done from anywhere there is a good internet connection to the market.
This rule requires that We simply must Develop an A-Game and Bring It to this Arena and is why is say,
Be About the Business of Growing Your Wealth!
Use the three rules below to monitor and exploit Mr. Market's
(shorter-term) cyclically evolving and yet perpetual (longer-term) nature.
It time, you can create your own version of these rules to achieve the goals above;
but start with the following as they work.
To be a CPT, we'll need a simple, repeatable business process that plays to our natural abilities.
— Rule No. 2 —
Focus the bulk of your time and capital on a few dissimilar investments
that are very likely to survive,
that will pay a market rate of return to hold,
and that are likely to see higher prices sooner or later.
Some common investment examples include:
A U.S. Large-Cap Stock Index Fund (e.g., SPY),
a U.S. Small-Cap Stock Index Fund (IWM),
an International Stock Index Fund (EFA), and
a U.S. Bond Fund (BND).
These are all examples of investments that can yield an average positive rate of return.
Unfortunately, the price per share of these example ETFs requires a lot of money.
If you are just starting out and cannot afford to buy even one share,
start by DCA into
one (or just a few dissimilar) index fund(s) like the examples above.
Use this time to develop a feel for Mr. Market's nature while building the size of your investment capital.
There is simply no need to take a capital loss in an investment that can survive market volatility,
that will pay you to hold, and that is likely to yield an acceptable profit sooner or later.
You cannot become a CPT if your trading strategy requires that you take a loss
whenever the market turns against your position,
which is likely to happen a lot.
You simply must avoid positions that can result in any permanent loss of capital.
Like the pros,
we need to become a specialist in our chosen survivable investments.
Knowing how these securities support their market value
and seeing how they acted under prior news and commentary
allows us to better predict how they should trade in the future,
and that creates a real competitive edge and the main reason the pros specialize.
Furthermore,
a big chuck of our CPT profit can come from income earned while waiting for that acceptable capital gain,
and that's the primary reason to focus on securities that'll pay us to hold.
Once CPT is achieved,
consider investing in one or more of the large-cap
Sector and Industry Index ETFs,
and then learn how to invest in a few of the best stocks in these large-cap ETFs.
These are the blue-chip stocks that are able to drive these index ETFs higher.
But only turn your attention to these after becoming a sector fund CPT
as these stocks are a lot more volatile and
are not as survivable as these index ETFs.
Only focus on top-quality investments with good growth prospects.
Learning how to profitably trade around a few core positions is true professional investment wisdom.
This is my Optimal Stop-Loss Mechanism.
— Rule No. 3 —
Trade like a professional value investor.
Buy low and only sell at some higher price
to book cyclical capital gains over-and-over again.
This will require patience,
sometimes a lot of patience,
and that is why we need to focus on survivable investments
that will pay us to wait for our next capital gain (Rule #2 above).
Ideally,
we want to only
Be a buyer at below-average Discount Prices and a Seller at above-average Premium Prices
as indicated by the (trading) range of prices seen on a chart of the security that we've chosen to invest in.
Charts allow us to leverage the wisdom of crowds,
to see what professional traders and investors are doing with their money,
which are responsible for 70 to 80% of the trading volume on an average day.
Professional investors, the Big Money, are very good at buying at discount prices and selling at premium prices.
Discount prices exist in the lower half of the trading range seen in charts
and premiums exist in the upper half.
Charts help us to receive the Message of the Market,
to understand when it is better to buy at relative discount prices,
to sell at above average prices when we have profits to harvest,
and when it is better to wait for even higher or lower prices,
which will come sooner-or-later.
Stock and bond market prices are forward looking, they are anticipatory.
Because they are forward looking,
they naturally trade in a dynamic Trading Range.
They trade with a margin of uncertainty.
This trading range reflects the market's collective view of fair value.
Professionals call this trading range a
Support and Resistance (S/R) Channel.
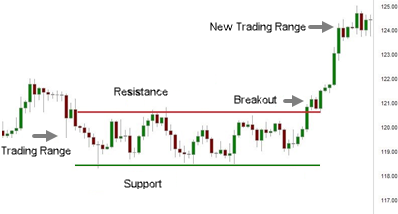 Refer to the second example chart that shows two trading ranges (S/R Channels).
This pattern of price behavior can be seen in every chart timeframe,
like on any intraday, daily, weekly, or monthly chart.
These trading ranges exist in multiple timeframes.
Bigger trading ranges exist in longer timeframes.
That is, the size (from top to bottom) of an S/R channel seen in a monthly chart
will be larger than that seen in a weekly chart of the same ticker
and that smaller channel will be somewhere within that larger channel.
The same can be said for the difference between a weekly, daily, and all intraday charts of that same ticker at that time.
These S/R Channels are all subject to change as news and commentary hit the market.
All S/R Channels can expand and contract.
A lack of news and commentary tends to cause a size contraction
as the pros jump in front of each other to be sure to buy just above likely support and sell just below likely resistance.
However, new uncertainty can cause an expansion as fewer pros are willing to reply on prior S/R levels
as indicated in charts.
And surprising news or commentary can cause S/R Channels in quicker timeframes to shift up or down.
Normal
trend behavior
can also cause quicker channels to shift up and down within the next broader timeframe.
Refer to the second chart again,
which shows prices breaking out and that channel shifting up to a new higher trading range.
Although not shown, it is possible that the higher and now narrower S/R Channel will later shifted back down a bit
or more likely simply expand downward to
test new support that was prior resistance.
It is also possible that it shifts up again or just expands or contracts a bit while moving sideways
and then shifts again,
all while staying within the next bigger trading range.
It's all this continuous price movement (volatility)
that makes it so hard to buy the channel bottoms and to sell the tops.
Prices can always go lower after we buy and higher after we sell.
We need to learn how to be okay with this price behavior because it will happen a lot.
It's Mr. Market's Nature.
Refer to the second example chart that shows two trading ranges (S/R Channels).
This pattern of price behavior can be seen in every chart timeframe,
like on any intraday, daily, weekly, or monthly chart.
These trading ranges exist in multiple timeframes.
Bigger trading ranges exist in longer timeframes.
That is, the size (from top to bottom) of an S/R channel seen in a monthly chart
will be larger than that seen in a weekly chart of the same ticker
and that smaller channel will be somewhere within that larger channel.
The same can be said for the difference between a weekly, daily, and all intraday charts of that same ticker at that time.
These S/R Channels are all subject to change as news and commentary hit the market.
All S/R Channels can expand and contract.
A lack of news and commentary tends to cause a size contraction
as the pros jump in front of each other to be sure to buy just above likely support and sell just below likely resistance.
However, new uncertainty can cause an expansion as fewer pros are willing to reply on prior S/R levels
as indicated in charts.
And surprising news or commentary can cause S/R Channels in quicker timeframes to shift up or down.
Normal
trend behavior
can also cause quicker channels to shift up and down within the next broader timeframe.
Refer to the second chart again,
which shows prices breaking out and that channel shifting up to a new higher trading range.
Although not shown, it is possible that the higher and now narrower S/R Channel will later shifted back down a bit
or more likely simply expand downward to
test new support that was prior resistance.
It is also possible that it shifts up again or just expands or contracts a bit while moving sideways
and then shifts again,
all while staying within the next bigger trading range.
It's all this continuous price movement (volatility)
that makes it so hard to buy the channel bottoms and to sell the tops.
Prices can always go lower after we buy and higher after we sell.
We need to learn how to be okay with this price behavior because it will happen a lot.
It's Mr. Market's Nature.
Predicting future price movements is hard,
and it's even harder to do with any consistency.
But it's not that hard to see that current prices may favor a little buying above support or selling below resistance.
However, most of the time, it will be best to just wait for better prices,
especially when we've already executed a trade at current prices
(e.g., we executed a buy at or about likely near-term support and
we're now looking to sell at higher prices or
buy more at lower likely support prices assuming a channel shift down).
Focus on the profits you're able to earn and that you can re-invest to realize a
compound growth rate.
Don't worry about the money left on the table and other things that are beyond our control.
Given all this volatility,
we need a way to improve our odds of success,
to be a CPT in our OET.
The answer lies in understanding that prices are likely to stay within the current quicker trading range for just a little while,
but more likely to stay within the next broader trading range and
even more likely to stay within the next longer timeframe, and so on.
All this channel shifting up and down is very likely to stay within the broadest trading range
(between Major Support and Resistance, which is often close to the 52-Week highs and lows seen on a monthly chart
and some weekly charts).
We can exploit this fact when we are forced to scale in.
We can manage our cash reserve and the deployment of that cash to leverage our rate of return as
market prices naturally wander through the various timeframes.
Take quicker trading range profits when you can
and work to earn whatever (potentially bigger) profits Mr. Market will offer up in bigger trading ranges when you must.
Professionals perpetually work the market they see in the security they specialize in.
They play to their strengths,
skills and abilities that can be grown and leveraged.
This is a big professional value investor's insight.
(Note that it is far easier to learn how to do this,
to become and retain CPT status in bigger, slower timeframes.)
Professional investors prefer to scale in and out as market conditions evolve.
Like them and all DCA Savers,
be a factional buyer at current prices and a bigger buyer at bigger discount prices.
Professional investors prefer to buy a little in the lower half of the current trading range
and to buy more in the lower half of the next broader trading range when given better discount prices.
Patiently waiting for prices to recover in the current or next longer timeframe.
Using LIFO
or Assigned/Specific Lot accounting,
be a fractional seller at current premium prices when you have an above average profit to harvest
or a bigger seller whenever it looks like the market is likely to take back an acceptable profit in that size.
Thus, supporting our
Primary
and
Secondary
Objectives above.
Learn how to profitably work the market we see.
But never forget that one of the most profitable trading and investing skills is to just sit on our hands.
Take comfort in the fact that we're being paid to wait for better prices.
Find the right balance between action and inaction given current market conditions.
When given better prices,
scale in and out, thus converting the single buy-low and sell-high trades into two averages
that can be managed and optimized.
Many professional values investor specialize in one or just a few investments
(Rule #2 above),
and they, as noted above, scale in and out based on market conditions and the amount of available cash they have to invest in that security.
When cash levels are high,
they don't need to see much of a discount to buy a little
(because you need to be in it to win it, to earn the current market rate of return).
But as the cash reserve goes down,
they need to see bigger-and-bigger discounts to justify an additional commitment of capital.
We can learn how to work (convert a near-term paper loss) into an acceptable longer-term profit;
and in time, we can learn how to grow our capital at an above-average rate of return
(Rule #4 below).
When we are first starting out and while our capital base is low,
only trade in longer-term trading ranges.
This is going to require a lot of patience and persistence.
But in time, the size of our capital base will grow,
and so will our ability to see and work quicker (smaller) channels.
Because picking tops and bottoms is so hard,
we simply must average (scale) in as prices approach the likely bottom of the current and next broader trading range,
and average back out as our prior buys yield above average or at least acceptable results.
This is not that hard to do.
But this will require a lot of patience, which may be hard to do initially.
This is a skill that anyone can master.
Just do your analysis, trade planning, and learn from the results.
We must learn how to work whatever market we get.
Only buy low, at timeframe relative discount prices,
and then hold and work the position until you've earned a market appropriate profit.
Do whatever it takes to maintain CPT status.
This approach can require a considerable amount of patience and self-disciple,
and that is why we need to focus on a few investments that can survive volatile markets and
that will pay us to hold.
This is true professional investment wisdom.
Ideally,
we'd like to buy just after the market has turned
(i.e., after Major Support, where a primary downtrend becomes the next primary uptrend, putting in a chart pivot low);
and to sell just after the market has turned again
(at Major Resistance, where a primary uptrend becomes the next primary downtrend, putting in a pivot high).
Professional traders work to do this to avoid an equity drawdown.
The thing is,
it is very hard to time these trades and is much easier to said than done.
Just like,
"Let your winners run and cut your losers short."
In fact,
attempting this is trying to beat the fast-money pros at their own game
in a security and timeframe that they specialize in.
Don't be this trading idiot!
Most that try just end up giving their money to Mr. Market.
Recall, we are investors using select trading tactics to improve our rate of return.
We are not professional traders that have master the stop-loss trade.
Most of our selected trading tactics include technical analysis to find likely support and resistance
based on prior chart history.
This is not that hard to do.
We'll then use Limit Orders to advertise our willingness to do that favorable trade.
Furthermore,
my research shows that the rate of return realized by targeting likely S/R levels tends to yield a rate of return
that is very similar to that realized by the average fast money pro after factoring in their stop-losses.
We'll just need to ride-out all those drawdowns, which is why we rely on Rules #1 & 2 above.
Be patient and take comfort in the knowledge that we're being paid well to wait for better prices.
Taking acceptable, preferably above average, profits when available
and working to minimize the impact of unacceptable losses or, better yet,
working (or waiting for the market) to convert an initial loss (a drawdown) back into an acceptable profit
is key to maintaining CPT status.
Learn how to profitably trade around one or just a few core positions.
Take quicker above average profits when available
and work to manage and optimize your averages relative to current market conditions
when you must do so to maintain CPT status.
This too is professional investment wisdom.
The size of our account will grow as we master this rule.
In time as our skills and account size grow,
we'll be able to consider more volatile alternative investments,
like those blue-chip securities within our initial index that have favorable relative strength
(i.e., one of the few tickers that are pulling our index higher while in a broader uptrend).
It's how many of the biggest and best investors (professional traders too) operate,
and it's how we too can generate real wealth in due time.
— Rule No. 4 —
Keep your Operations In-Sync with the Health of the Broader-Market Trend.
Simply put, the easy money is generally made trading with the broader (primary) market trend.
When in a primary bull market, which is most of the time, look for buy-the-dip trading opportunities
(to buy-low and then sell at some higher price);
and when in a primary bear market, just go to cash
(e.g., a money market fund or a short-term government bond fund) and,
if allowed,
look for shorting opportunities.
This is my Ideal Stop-Loss Mechanism.
With that said,
mastering this rule can greatly help us to better achieve our
Secondary Objective;
but this will require a lot of time and effort.
Rule #3
above has us focus on the fact that market prices tend to trade within a range of prices (a S/R Channel).
This rule has us also focus on the fact that
market prices tend to trend, up, down, and sideways, within the current and next broader trading range
as seen in various timeframes.
Warning: Focus on longer-term trends and on trend health.
Professional Wall Street likes to keep us focused on the current (shorter-term) trend.
Why?
Because that encourages us to play their game on their terms.
Most new trend (momentum) traders try to work quicker trends,
which is effectively competing with the professional Fast Money traders
that specialize in that security in that timeframe.
Please, don't do this.
Learn how to play to your strengths.
Focus on your ability to bring a methodology with favorable odds (Rule #1),
your ability to focus on investments that are relatively easy to profitably work
(Rule #2),
and your ability to patiently wait for favorable prices
(Rule #3).
This rule is about learning how to see favorable trading opportunities in the chart set of the broader market index
and each security that you've chosen to specialize in.
This generally requires a lot of chart viewing (technical analysis).
We can use the current price action and volume relative to historic price pivots
(i.e., the prior highs and lows, which define the size of the current trading range) and
a standard set (e.g., 20, 50, & 200) of Simple Moving Averages (MA)
to gage the health of that trend.
A healthy trend is likely to continue, and an unhealthy trend is likely to reverse.
We need to learn how to see trend health so that we can improve our rate of return.
The human brain is a natural pattern recognition engine.
But this requires that we look at a lot of data (charts) over-and-over again to properly train our minds
to be able to quickly see favorable trading opportunities.
Given that, we then jump on it, trade it as planned, and learn from the results.
We're working to develop a simple methodology that we understand and trust.
But this will take a lot of repetitive time and effort.
Focus on those patterns that put money in our brokerage account
and learn to ignore all the others as just more market noise.
This rule is initially about learning what to look for,
and I'll identify some things to look for.
But you'll need to teach your mind to quickly see these favorable patterns.
When they show up in the chart set,
develop the ability to take whatever profit the market will allow.
Always start with small position sizes to limit your exposure to a permanent loss of capital,
as some of this may require a stop-loss trade —
We should learn to avoid those trades that require this skill.
And once again,
always start in longer (slower) timeframes,
as they are easier to trade
but this requires more patience.
Be patient and methodical,
which is a skill set that anyone can bring to this game
and that Mr. Market tends to profitably reward.
Given that obtainable skill set, then leveraging that ability
by safely adding size and/or working quicker timeframes.
Always focus on our Primary Goal.
We simply must attain and maintain CPT status for each favorable trading pattern skill that we can develop,
while we develop the ability to achieve a better rate of return,
our Secondary Objective.
Warning:
There are a lot of books, courses, etc. out there that suggest they can teach you how to trade like a pro.
And maybe they can;
but most are designed to sell books, etc. by offering up the notion (dream) that you can be the next superstar trader.
Many show and document a ton of patterns to look for.
It is important to understand that every favorable pattern setup
will either run as expected or will fail,
and the odds of either can also be a little better than a coin flip.
Thing is,
on Wall Street as in the big casinos,
a fortune can be make working a methodology with slightly favorable odds.
Most of that requires that we work the process as planned
to allow the odds to pay off as expected over time.
It is very important to have a plan to trade when you see your pattern show up in the data.
This plan needs to say what you'll do, if the pattern runs as expected
and what you'll do when it fails.
Most of the dogma says,
"Execute an appropriate Stop-Loss trade."
and that can work if you're able to develop that skill and still be a CPT.
I find that most cannot!
I repeat,
the best Stop-Loss trade is to avoid those trades and methodologies
that require this approach.
Use the rules above to select opportunities and techniques that
allow you to converter an unavoidable timing mistake
(a failed pattern run)
into an acceptable profit sooner or later.
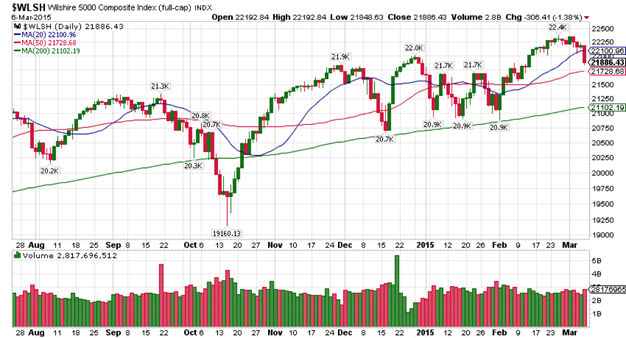 Refer to the daily chart that shows prices in a healthy up trend.
Prices are riding the green 200-day MA higher.
Notice how prices tend to bounce off that 200-day support level,
putting in mostly higher pivot lows.
This is a sign of a healthy up trend.
When prices get too far away from (above) that MA,
prices tend to find resistance and put in a pivot top.
A pattern of mostly higher pivot highs.
This chart includes some examples of trading range highs and lows (pivots prices),
like 20.2K on the far left side and 22.4K on the far right.
We can draw a line through these pivot highs and project that into the future
to see the likely top of this broader S/R Channel.
We can use the 200-day MA on this chart as the likely bottom of the same channel.
But everything is subject to change over time,
and we need to learn how to work the market we see.
The primary trend is very likely to continue until prices reach the top or bottom of the current trading range
where the primary trend reverses, putting in a chart pivot.
Refer to the daily chart that shows prices in a healthy up trend.
Prices are riding the green 200-day MA higher.
Notice how prices tend to bounce off that 200-day support level,
putting in mostly higher pivot lows.
This is a sign of a healthy up trend.
When prices get too far away from (above) that MA,
prices tend to find resistance and put in a pivot top.
A pattern of mostly higher pivot highs.
This chart includes some examples of trading range highs and lows (pivots prices),
like 20.2K on the far left side and 22.4K on the far right.
We can draw a line through these pivot highs and project that into the future
to see the likely top of this broader S/R Channel.
We can use the 200-day MA on this chart as the likely bottom of the same channel.
But everything is subject to change over time,
and we need to learn how to work the market we see.
The primary trend is very likely to continue until prices reach the top or bottom of the current trading range
where the primary trend reverses, putting in a chart pivot.
How prices trade relative to the standard 20-, 50-, and 200-period MAs
is another good way to gage trend health and
to judge relative price discounts and premiums.
When prices are trading above and finding support off a rising MA,
the market is signaling bullishness, and prices are trading at a broader relative premium and
that is likely to continue.
We want to be a buyer as prices drop to a rising MA
(i.e., a Buy-the-Dip trading opportunity).
Trade volume often drops as prices approach a likely S/R Level
and increase after a bounce off that S/R Level,
which is another sign of a healthy trend.
When prices are trading below and finding resistance at a falling MA,
the market is signaling bearishness, and prices are trading at a broader relative discount.
We want to be a seller as prices rally to a falling MA
(i.e., a Sell-the-Rips shorting opportunity).
This price action, the broader market trend, is likely to continue until prices approach a prior 52-week pivot high
(at prior major resistance level) or 52-week low (at prior major support level)
as best seen all monthly charts that have a full 200-month MA and on most weekly charts
(in a chart that shows 5 or more years of data).
Generally,
when prices fail to make a higher-high on more bullish news and commentary,
we're at likely major resistance.
This is particularly true in longer timeframes when prices are near the top of the weekly or monthly chart.
It is then time to take profits and to minimize losses in riskier trades.
Alternatively,
when prices fail to make a lower-low on more bearish news and commentary,
we're at likely major support.
Here too, this is particularly true in longer timeframes when prices are near the bottom of the chart.
Learning how to see patterns with favorable odds is a good way to improve our rate of return.
Let's take a closer look.
As noted above,
Market Prices Tend to Trend,
Chart Pivots define the size of the current Trading Range,
and Trading Ranges exist in Multiple Timeframes
(Example timeframes include a monthly view, a weekly view, a daily, and an hour view
of the same stream of trading data that can be seen on charts set to each sample size).
Furthermore,
we want to keep our operations In-Sync with the Health of the Broader-Market Trend.
With all that restated,
I suggest that we focus on these ideas as we learn how to analyzing our ticker in multiple timeframes.
Dr. Alexander Elder's introduced his Triple Screen Trading Strategy in his classic book
Trading for a Living,
where he suggests that we use the next longer timeframe to set our (bullish or bearish) trading bias.
Let's say we're trading the weekly chart.
That's the timeframe we are working while maintaining our CPT status.
We'll use a healthy trend in a monthly chart (view) of our ticker to determine
if it is best to go long or short.
This is the timeframe we'll use to trade with a healthy broader market trend
(i.e., We're trend trading in this longer timeframe).
A lack of a healthy trend indicates that it is best to just
wait in cash for a better trading environment or look elsewhere for better odds of success.
We'll use the current (weekly, our intermediate) timeframe to seek entry and exit trades.
Assuming a healthy trading environment,
we'll use a counter-trend move into support or resistance to
enter, add to, exit, or reduce the size of our position.
In this timeframe, we're primarily range (swing) trading.
We'll use the next shorter-term (daily) timeframe to optimize the timing of our trades
as prices begin to move with the broader-market (primary) trend as seen in our longest timeframe.
In this quickest timeframe,
we're working to improve our rate of return and
to minimize any drawdown caused by the counter-trend trade in our intermediate timeframe.
This multi-screen analytical and planning approach is a true professional trading tactic with very favorable odds.
Once this approach is mastered in a longer-term chart set,
try doing the same thing with a quicker set of charts,
like weekly, daily, and hourly.
We need to develop an understanding of what each chart is showing us
(an ability to receive the Message of the Market).
That is, we want to see the broader market trend, the health of that trend,
and the set of trading ranges in various timeframes that we can work
to convert a timing mistake into an acceptable profit
to maintain CPT status.
Let's take a closer look at the chart above.
On this daily bar chart,
each bar
summarizes the trading range data for each sample period (bar) on the chart
with the latest data (bar) being (created) on the far right edge of the chart.
That far right bar is subject to change while the market is open for normal trading in that sample period
(e.g., on a daily chart, the far right bar only stops changing after the 4 pm closing trade on Wall Street).
On a weekly chart each bar summarizes a week of data, but it takes a week to finish generating the next (far right) bar.
Longer-term charts naturally show bigger trading ranges and are more fundamentally grounded
because the biggest and best portfolio managers operate mostly in longer timeframes.
These pros can properly do the fundamental analysis that guides their market operations.
On Wall Street,
money naturally flows to the best investors and so the size of their portfolios grows.
It just takes time for them to adjust their asset allocation without negatively impacting their rate of return.
This is a profitable insight.
You want to see what these big guys are doing and invest with them.
Focus on trade volume, big money creates bigger than average volume
as best seen on longer-term charts.
Longer-term charts are also more likely to show the range of likely future prices,
just project the current broad S/R Channel into the future.
There will be surprising exceptions,
but the overwhelming majority of all future prices
are likely to be within the highest and lowest prices seen on a monthly chart.
If your security (ticker) cannot fill a monthly chart,
it may not be a survivable investment.
An investment that has been trading for a decade or more
is likely to be around for another decade,
when the economic value backing that security is likely to be desirable in the future.
Buys in the lower half of a broader trading range of a survivable investment
are more likely to see profitable prices sooner or later,
are also likely to yield above average rates of return,
and this is a very profitable insight.
But it is hard to be patient and that is why new traders and investors gravitate to quicker timeframes.
There are even quicker intraday timeframes
(e.g., 1-, 5- and 15-minute charts),
but these are too noisy and erratic for most to profitably trade.
Plus, few have the time and ability to just sit and watch intraday charts
while they wait for a favorable setup.
And if you don't wait for those favorable setups,
you are just competing with the Fast Money,
the best professional traders in the world.
If you are going to compete with the best traders in the world,
don't be surprised when you lose CPT status and give away more-and-more of your trading account.
However, it is not that hard to periodically check an appropriate chart set to see
if current market prices are supportive of our need to maintain CPT status.
Let me repeat,
it is far easier to become and retain CPT status in longer timeframes.
As indicated above,
these S/R Channels exist simultaneously in multiple timeframes
with bigger (longer) timeframes having bigger channels that contain smaller (quicker) channels
(i.e., smaller trading ranges within bigger trading ranges within even bigger trading ranges).
These S/R Channels have a noisy, erratic, quasi-fractal
(self-similar) relationship.
Remember, all channels have a tenancy to expand and contract based on investor confidence that is subject to change.
They also tend to shift up and down in quicker timeframes within their next broader timeframe
in response to surprising news and commentary.
I repeat this because being able to understand and see this helps (a lot) to being able to determine trend health
and see favorable trading opportunities that'll come and go over-and-over again.
Learning how to see and exploit this is the biggest problem facing all traders and investors.
Many professional investors rely on their version of Rules 1, 2, and 3 above to effectively deal with this,
and so should we.
Professional traders rely on their ability to let their winners run and cut their losers short.
However, most retail investors will never master that trading skill and will just lose too much of their savings
on the way towards this realization,
which is the justification for rules 2 and 3 above.
Mastering this rule (#4) can be used to better judge when it might be best to exercise a stop-loss trade.
But don't be too quick to give your money to Mr. Market.
Given appropriate security selection and an adequate cash reserve,
almost all, if not all, short-term drawdowns can be turned into an acceptable longer-term profit
given time and effort.
Only do this stop-loss trade when it becomes clear to the more experienced version of you that a
stop-loss here will empower a later loss recovery with a profit that can overcome the loss taken,
which is far easier said than done.
It is always best for us to think like patient investors that can use some appropriate trading techniques to improve our rate of return.
Once CPT status is achieved with one or more broad-based index funds,
we can then consider an issue (a.k.a., a security or ticker) with strong
Relative Strength (RS) performance within that index.
These stocks are more volatile (have bigger S/R Channels) but most blue-chips also offer bigger dividends.
These issues can also be a little riskier
(i.e., may not be as survivable),
which is why we need to obtain CPT with the index first
before applying the same trading tactics to a more volatile security in that index.
It is very important that we approach the market as consistently profitable investors first and as traders second.
However, as our trading skills grow,
we can work to retain CPT status in quicker timeframes
and with bigger positions.
Just be patient and methodical.
Only lean into trading tactics that you clearly understand and have mastered.
Always maintain the bulk of your time and investment capital in
securities and methodologies that are very likely to deliver
the rate of return needed to preserve our
Primary Objective
while working to achieve our
Secondary Objective.
— In Summary —
Our Primary Goal is to be Consistently Profitable.
Maintain a Positive Rate of Return to yield a very doable compound savings growth rate.
Our Secondary Goal is to Improve our Rate of Return,
While maintaining our primary objective.
Think like an investor, have a longer-term focus;
but understand that every investment begins and ends with a trade and
we can improve our trading skills to yield a better rate of return from our investments.
Rule #1 — Be about the Business of Growing Your Wealth.
Predicting future prices is hard, even for the pros.
But it is not that hard to periodically monitor current market prices
to see if it is now better to buy, sell or wait for better prices.
This requires that we maintain an adequate bookkeeping system
and an appropriate iterative methodology.
Rule #2 — Focus on a few Dissimilar Survivable Investments that Pay you to Hold.
This rule gives us the option to hold a drawdown while we wait to book our next profit.
Rules 1 and 2 enable us to achieve our
Primary Objective.
Rule #3 — Trade like a Professional Value Investor.
This rule gives us the option to work (scale in and out) as market prices swing up and down within various trading ranges.
Rules 1, 2, and 3 enable us to begin to improve our rate of return while maintaining our
Primary Objective.
Rule #4 — Keep your Operations In-Sync with the Health of the Broader-Market Trend.
This rule requires a lot more work and skill, and it leverages the three rules above.
However, it can be used to seriously achieve our
Secondary Objective,
while still maintaining our
Primary Objective.
Mastering these rules (or your version) is the key to successful investing with your best possible rate of return.
It is the best way I know to grow from a Beginner
to a Consistently Profitable Trader
(someone who can use positive compounding to generate real wealth in the markets)
to a True Market Professional,
(someone who can make a living in the markets, preferably on their own retirement savings).
Work to develop your own track record of success.
A methodical trading process with favorable investment odds can get you to and through retirement.
— More Information —
A friend, let's call him or her Sam,
asked me for a more concrete example of how s/he could apply my Simple 2X4 Approach in the current market.
Here's a link to an edited version of my email response to that request.
Here are some other web pages to consider.
The first takes a closer look at My Trading Insights & Approach,
the second is a set of rules that govern my Retirement Planning,
the third takes a deeper look at the Economy and Markets,
and the last takes you to a summary look at my trading business.
Some of this may be redundant, and I apologize for that.
Writing and revising these papers helps me to better understand and remember what I've learned,
need to bear in mind during the trading day to protect myself from the emotional whirlwind that Mr. Market unleashes,
and that may hopefully help you along your way to becoming a CPT and maybe a true market professional.
This I have done, and there's nothing special about me;
so, I say with confidence, you can do it too, if you are willing to work for it.
Stan Benson