Compound Growth
Compounding can do amazing things to grow wealth.
In fact, it is the most effective way to invest for your future needs.
Compounding will naturally occur over time;
and it will magnify whatever results are realized in a savings account.
If an investor tends to earn profits,
at least more and bigger profits than loses,
compounding will magnify profitable results.
Warning, the alternative is also true.
If a trader tends to earn more loses than profits,
compounding will hollow out a savings account.
Favorable compounding takes time and money.
It's basically earning new money (capital growth) on top of prior growth from prior savings
(the initial investment capital),
one compounding period after another,
thus creating a non-linear (upward sloping) growth curve over longer periods of time
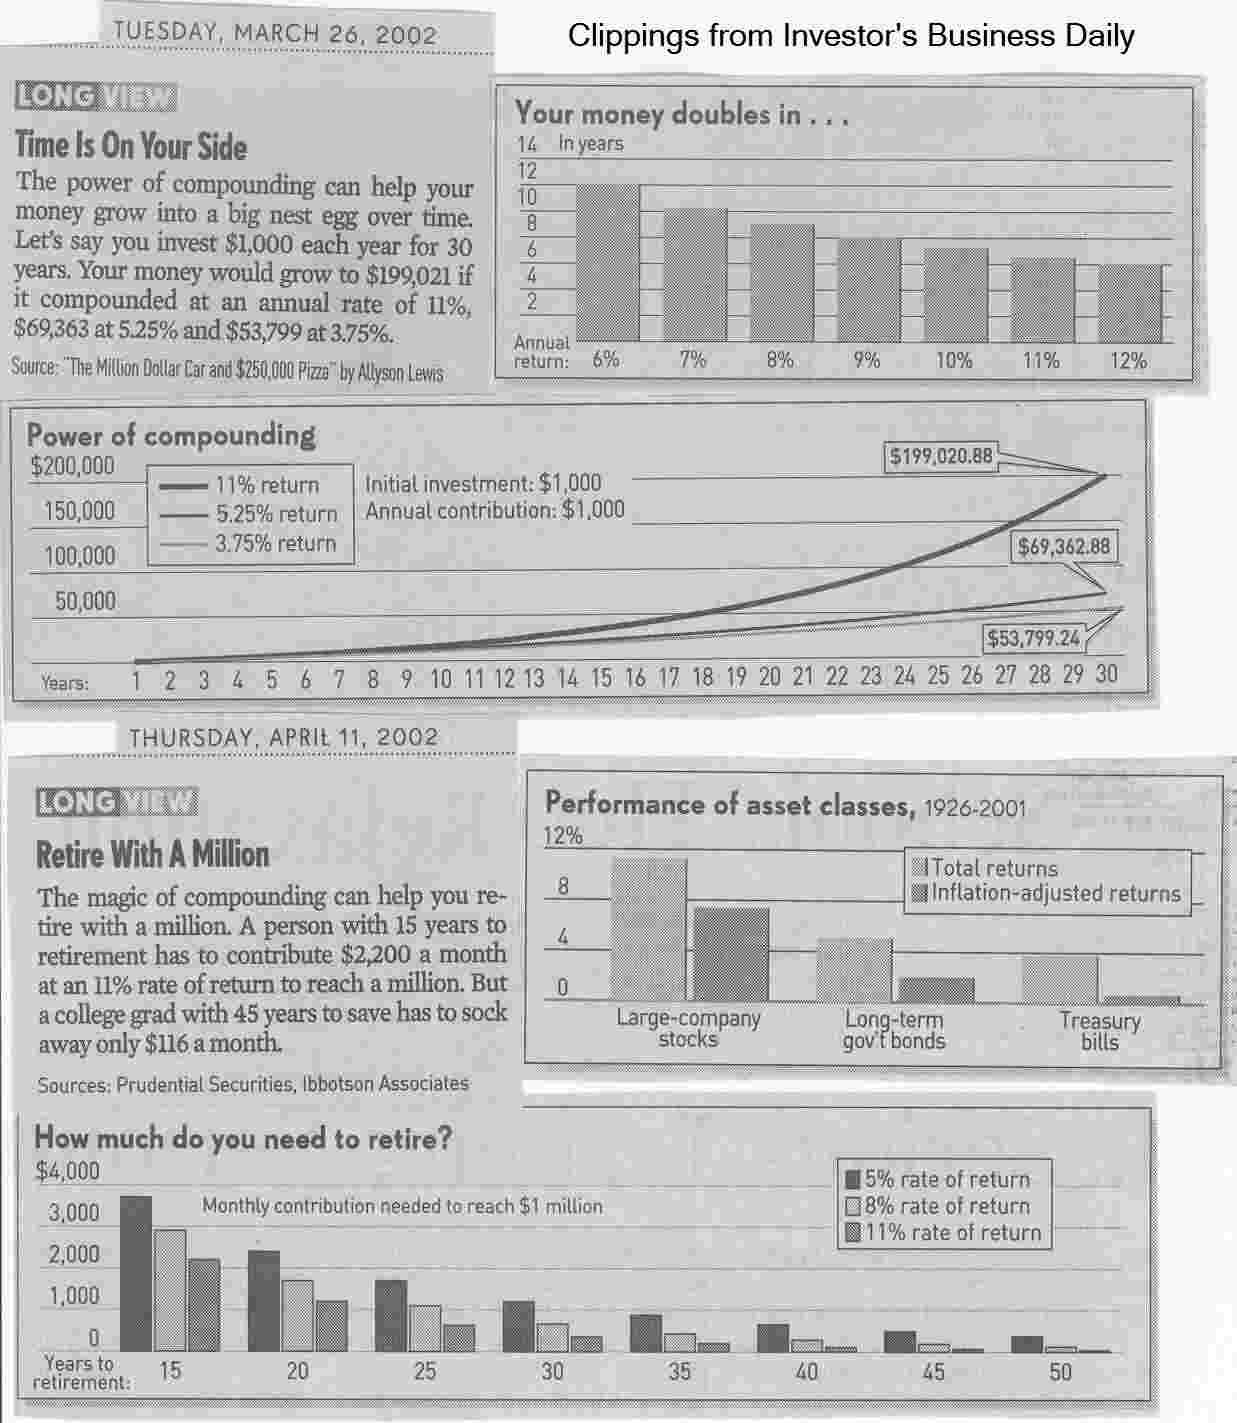
as seen in the "Power of compounding" newspaper clipping below.
Compounding starts slow,
but after a few decades
(e.g., two to three or four, depending on the rate of growth and how much you can continue to save),
that savings growth accelerates to the upside
and can make you truly rich,
relative to the percentage of your earnings that you are able to save
(e.g., save 10% of each paycheck,
learn to Pay Yourself First).
It's never too early to start saving for retirement;
and the later you wait to start,
the more you'll have to save to catch up,
which is the only effective way to catch up
(don't make the common mistake of thinking that taking on more risk to realize a greater rate of return is the answer
as that approach tends to yield greater losses,
which actually makes the problem worse).
It's hard to realize rates of return much above
the market's long-term average,
which is variable (e.g., about 8 to 12%).

Here's a real-world example to consider.
If you put $10,000 into a tax-sheltered investment (e.g., an IRA) that grows at an 8% compound rate,
after 30 years you'd have $100,626.57
(refer to the table below).
That's the way the math works;
any dollar invested at an 8% compound rate would be worth a little more than 10 times as much after 30 years.
Click here
to play around with a Compound Annual Growth Rate Calculator to get a feel for how the math works
or just refer to the table above,
which shows how $10K would grow at different rates over a different number of years.
Notice how the growth increases at an increasing rate over time;
that's the magic of compound growth.

We tend to think of compounding as being something that happens at regular intervals
(like in the table above)
because interest and dividends are normally paid at regular intervals.
We also tend to assume that those cash payments can be reinvested at the same rate of return.
But this is rarely the case in real life.
Compounding tends to occur at irregular intervals, and
generally at the currently available rate;
and this is particularly true when we consider capital gains.
For example, we buy stock XYZ for $10 per share and sell it later for $11
to earn a 10% holding period rate of return.
We then use all the proceeds from that sale to buy back in at say $10.11 and
later sell again for $11.12 to earn a little less than 10% again, etc.
which is a simple strategy many professionals traders tend to work.
They simply buy support and sell resistance
along the broader market trend over-and-over again.
Each profitable trade (capital proceeds plus any income earned) reinvested over variable holding periods is an example of compound growth
in a brokerage account.
Some (growth) stocks (and by extension stock indices with growth components) are able to grow at a compound rate too,
when the underlying business(es) is(are) able to grow or create value at a compound rate,
thanks to that business retaining earnings and reinvesting in profitable growth opportunities available to them.
Buying back shares (making each outstanding share worth more because of the greater claim on that business
is another way to realize compound growth.
For those investors that prefer a Buy-and-Hold strategy to minimize the tax burden over bigger cyclical swings
(e.g., during the boom-phase of the economic/market cycle),
investing in growth stocks or indices is the way to go.
The most import things to understand about compounding rates of return:
- It is the mathematical progression that creates real wealth over time
when a string of reinvested payments (profits) are run together one-after-another-after-another ...
- A string of losses, one-after-another, yields compound wealth distraction,
and is the primary reason why we need to trade like a professional investors
(to become a Consistently Profitable Trader)
and not like the popularly touted short-term, fast-money, professional traders
that are schooled to Cut Your Losers Short and Let Your Winners Run
(a Loser's Game for all but the best-of-the-best).
- The next thing everyone wants to know is the Rate of Return (the yield) on their investment,
which is a ratio of change expressed as a percentage
(e.g., "She earned a 10% yield on that investment").
We simply divide the proceeds
(i.e., the sum of all the money coming out of the investment)
by the cost of the investment (this division creates the ratio of change),
and then we subtract one (to create that percentage or rate of change).
This value is called the Holding Period (rate of) Return (HPR).
For example,
let say we invested $1,000 (bought 100 shares of stock for $10 a share)
and 30 days later we realized a return $1,100
(we sold that position for $11 a share, earning $100),
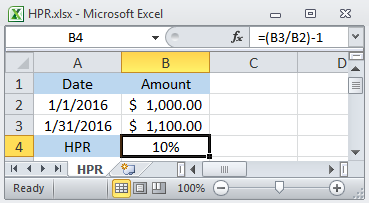
that would be a 10% HPR = ($1,100 / $1,000) - 1 = .1 or 10%
(refer to the formula in cell B4 of the Excel example "HPR.xlsx" below).
But to compare this Rate of Return (yield) to alternatives
we need to Annualize that figure,
which is also known as the Compound Annual Growth Rate (CAGR),
which requires that we take the HPR and raise that to the power of one divided by the ratio of time held relative to one year
(365 days) and then we subtract one.
Continuing the example above,
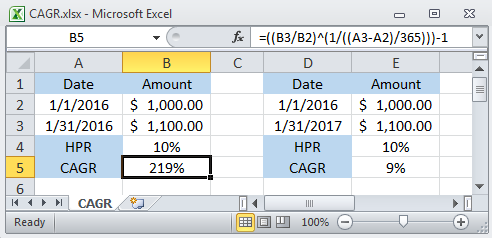
the CAGR = .11/(30/365)-1 = 2.19 or 219%
(refer to the formula in cell B5 of the Excel example "CAGR.xlsx" below).
If we realized that 10% HPR after a year and 30 days
the CAGR = .1 1/(395/365)-1 = .9 or 9%,
a little less than 10%,
which proves the old adage "It's always better to earn money quickly.",
it has a higher Rate of Return,
which is also why we must annualize for comparison purposes.


(I know that the math can sometimes be a bit of a pain,
but once you've created the initial spreadsheet,
just copy and edit the parts as needed;
and I'm also happy to give you a copy of these.)
- Because compounding can and often does occur at irregular rates and with irregular cash-flows,
we'll need to use an extensive Internal Rate of Return (IRR) calculation
to get the correct annualized growth rate.
The math can be a bit of a beast, and almost no one wants to do it manually;
but fortunately, we don't have to.
We can simply use a two column Excel spreadsheet
and the "=XIRR()" function
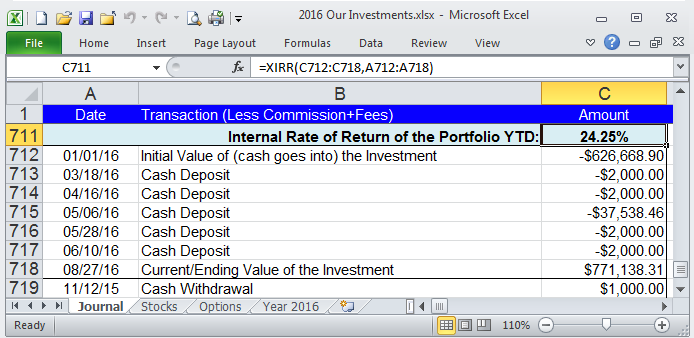
(refer to the formula "=XIRR(C712:C718,A712:A718)" in cell C711 of the Excel example XIRR.xlsx below).
Note that Excel has two similar functions IRR() and XIRR() —
the first (IRR) is used for regular (a series of equal) cash-flows,
the other (XIRR) is used for irregular cash-flows and is the one we want to use.
Our spreadsheet uses one row per entry (cash-flow transaction, rows 712 to 718 in the example).
The first column (the vertical range of cells "C712:C718") in the XIRR function
is for the dollar values of each transaction,
and the other column (cells "A712:A718") in the XIRR function is for the date of the transaction
(column B is not used by the function and is there for user notes about that transaction).
Note that the formula (XIRR function),
just like calculators that are able to do this,
require that cash in-flow values use a minus sign
(think of it as money flowing out of your pocket to fund the investment) and
cash out-flows use a positive (or no) sign
(money flowing back into your pocket to reinvest elsewhere).
The first row is for the initial (starting) date and value in a brokerage account or to fund a project or an individual investment,
it's the money going in (row 712).
Every row after that is for the various cash-flows in or out
(rows 713 to 717).
The final row is for the current or final date and value,
and is the money coming out (row 718).
The spreadsheet automatically does the math and can even track the current date
(using the "=TODAY()" function in cell A718).
All we need to do is set it up,
add any cash flow transactions as they occur,
and observe the real-time
Compound Annual Growth Rate (CAGR),
which is the value seen in cell C711,
it's the Annualized IRR growth for the Year-to-Date data in that brokerage account.
Note that row 719 is not used in the example calculation;
it's there as a template of a cash out-flow from a prior year
that can be cut or copied, then pasted into the IRR table (between rows 711 and 718), and then easily edited
when that type of entry is required.

Stan Benson


