My Market Insights and Approach
If you are new to trading and investing,
market prices may seem to randomly trade up and down without rhyme or reason,
and when we take a position in the market the value of that position goes up and down too,
tracking market prices;
and therein lies the blessing and the curse.
We would all love to see the value of our investment go up and up just after we buy,
and down just after we sell
(we hate to see prices continue up after we sell).
But we don't get to live in that world;
and being disappointed when the normal ups and downs of reality happens is, well, just unrealistic.
When we buy into the market (take a position) to earn a highly possible and attractive Market Rate of Return,
we face the real risk of a periodic reductions in value along the way.
The Market Rate of Return
is on average about 5% for an all bonds index and about 10% for an all stocks index over longer timeframes,
compared to much lower
rates from traditional bank savings accounts and
CDs.
The rate of return on specific individual investments will vary and
depend on its growth characteristics, longevity, and the timing of the buy and sell operations.
That risk, just like the reward, can be either temporary or permanent,
and much of that will depend on us.
It is very important that we develop the ability to be okay with normal market volatility,
learn to see it as a blessing,
and that will generally take some time and exposure to that volatility and a general understanding of
what the markets are all about.
Jack Bogle,
the founder of index investing,
advocates that retail investors should just forget about all this market timing,
which is very hard to get right,
just buy and hold (invest in) a low-cost, broad-based stock market index fund, like his.
In my humble opinion,
this is the right way to start
because
1) it takes money to make money in the markets,
and the more we have,
the easier it is to safely make even more,
2) it is very hard to consistently time the market turns, and
3) this is a good way to save and earn the market rate of return
while learning how to harvest and effectively leverage this growth engine.
Just setup an investment plan that automatically takes,
say 10%, out of each paycheck and invest that into an index fund
(more on this later).
As you save,
you should periodically follow the market's price action to develop a feel for the market's nature
and learn as much as you can about investing in our economic system.
At some point,
hopefully well before reaching retirement and need cash to live on,
you're going to want to be able to effectively manage your retirement savings.
That is,
to effectively capture and retain more of the wealth that we can earn in volatile markets.
In the balance of this document
I'll talk about what we can do to minimize the risks of a permanent loss
and improve the odds of realizing a long string of permanent rewards
that we can live on or re-invest for later consumption.
There are basically two ways for the average investor (saver) to make money
on Wall Street
(the markets for tradable securities):
- Earn a Capital Gain —
A capital gain is realized whenever the proceeds from a sale of an investment exceeds the cost to acquire it;
and that's the foundation for the old saying, Buy low and Sell high (or at some higher price).
- Earn Investment Income —
Money can be earned from the ownership of income producing investments.
Examples include dividend income from equity
(stocks),
interest income from debt
(bonds),
and rental income from a real estate investment
(e.g., REITs).
These are all examples of being paid to hold;
and over the long run,
a significant portion (almost half) of all market returns are derived from investment income.
The sum of these two (capital gain + income) is called Total Return.
Economic growth and
stock buybacks
tends to cause price appreciation for stocks over time,
and these are two other examples of being paid to hold an equity investment
that may not pay a dividend,
which can be very tax-efficient.
We want to earn the market rate of return,
and once we have met or beat that objective,
we simply must take some or all of that profit off the table.
We need to book (lock-in) that rate of return,
and then re-invest the proceeds to earn a compound rate of return,
which is the real key to wealth creation in the markets.
Capturing the market rate of return should be our principal motivation to accept volatile
Market Risk on Wall Street.
It is important to understand that market prices go both up and down.
What the market giveth, it can just as easily taketh away.
We can't control market prices.
Prices will go wherever Mr. Market wants to take them.
We can, however, control our approach to the market.
We can control what we'll invest in and when we'll do our buying and selling.
We can also choose to go in blindly,
be led by others who may or may not know what's best for us,
like the guy or gal on TV or in an ad for this or that investment,
or we can choose to do what we can to study (analyze) available information
about what works or at least has favorable odds of working
and what does not.
We can also choose to take advantage of Mr. Market's pricing mechanism
when a trade is likely to yield an attractive market rate of return (sooner or later)
and to ignore those prices that appear to be less fordable
(are just more useless noise).
We'll need someone that will always be there for us,
has a track record of success,
and will always have our best interest at heart.
If we (you) can't find that person,
consider becoming that person.
It's not that hard.
It just takes time and effort
and is very likely to feel a lot like a part-time job.
But if done well, that work could become a nice business opportunity or
result in an early retirement once we've reached our
Financial Freedom Numbers.
To that end,
let's start by taking a closer look at what other successful investors have said about Mr. Market
and his manic-depressive nature.
In the short run, the market is a voting machine;
but in the long run, it is a weighing machine. — Benjamin Graham
Buy Low and Sell High, we're told, is how to make money in the markets.
But that begs the question, What's low, and what's high?
One tried-and-true approach is to do a
fundamental analysis
of the security in question to understand if current market prices are high or low relative to expected future value.
But this approach is easier said than done;
and even when done well, may still prove to be wrong in the near-term future.
Securities that are free to trade at market prices naturally trade up and down in a dynamic range
that reflects the market's evolving expectation of likely future value in the timeframe under consideration.
An alternative approach is called
technical analysis
and is a lot easier to do.
But it can also be wrong near-term.
However, both approaches are likely to be correct over longer timeframes.
We can use technical analysis to see these trading ranges,
an indication of what is expensive and what is cheap (i.e., what is high and low).
Note that most of the financial assets traded on Wall Street (the markets) are professionally managed
based on their ability to do a proper analysis of expected future value.
So, technical analysis is a way to leverage the market's collective
wisdom
of when a market is trading at a rich premium or an attractive discount,
and we can see this in a price chart of that timeframe.
Example timeframes include a monthly, weekly, daily and an hourly chart.
There are even quicker timeframes,
but they are too noisy and erratic for most retail investors (plus, who has the time to watch them?).
Longer timeframes tend to be more fundamentally grounded
and this is a very profitable insight.
Technically speaking, there is actually a set of trading ranges
within trading ranges.
One in each timeframe.
They are a somewhat noisy (semi-random), quasi-fractal (self-similar) collection of smaller (quicker)
semi-cyclical (trending up and down) trading ranges with larger (slower) trading ranges (timeframes).
For example,
consider a daily chart where each bar (the data sample size) summarizes one day of trading
(the bar indicates the Open or the price of the 1st trade in the sample, the highest price,
the lowest and the last trading price),
within bigger trading ranges,
like on a weekly chart where each bar represents a week (five days) of trading.
Going from smaller (quicker) to larger (slower),
they are trading ranges within trading ranges within trading ranges and each is progressively bigger in size
(the vertical difference between high and low prices).
This quasi-fractal relationship exist because the professionals operating in, that have mastered, each timeframe
are all playing their version of the same profitable game
(i.e., buy low, at likely near-term discount prices, and sell high, at likely near-term premium prices)
all based on their superior ability to see and harvest profitable swings in their trading range.
These trading ranges have a natural tendency to trend, a momentum component.
When the underlying economics are presumed to be improving the trend is up,
sideways when stable, stagnate or when prices simply need to rest (giving the underlying economics time to catch up),
and down when the active majority of market professionals believe the economy is deteriorating.
This price action and new information, the collective wisdom, can be thought of as the Message of the Market.
We can use this information to improve our odds of successful.
We want to invest with the crowd when the message is likely to be true (right about the future) and against that message when it is likely to be wrong.
We need to develop the ability to receive and correctly evaluate the message of the market.
Successful investing is anticipating the anticipations of others. — John Maynard Keynes
News and commentary can get prices moving,
creating a new counter-trend move or a continuation of the primary (longer-term) uptrend or downtrend.
Prices often move in a type of stair-step fashion,
with a few steps forward followed by a smaller counter-trend pullback,
often as a result of profit taking,
and then a few more steps forward as traders and investor start or add to their position in the market.
It is important to understand that market prices are both forward- and backward-looking.
Trades (market prices recorded on the ticker tape, a historical record for all to see) executed by active traders and
investors repositioning their portfolios to benefit from what they believe is the next likely future trend,
do so in an attempt to anticipate the actions of other market participants.
Professionals (the Smart Money) are responsible for about 70 to 80% of all trading volume on most days.
So, their anticipatory activities make market prices forward-looking,
and this is a form of self-filling prophecy (i.e., our collective beliefs and actions makes it happen to a noticeable degree).
But market prices are also (ultimately) based on reports from
(and informed commentary on economic activity at and about)
the various businesses and government entities that issue the marketable securities
(e.g., stocks,
bonds, and
mutual funds
which are a professionally managed portfolio of stocks and/or bonds)
that we all can buy, sell and hold in a brokerage account.
These tradable securities are a claim on some future value.
There's an old Wall Street saw,
Buy the rumor, and sell the news.
This is the smart money anticipating the anticipations of everyone else in the market;
and this, hopefully, explains why prices can rally in anticipation of good news and then sell-off after that good news is reported as expected.
But when news and commentary run counter to forward-looking expectations,
when the smart money gets it wrong,
market prices quickly
(efficiently) correct,
factoring in the new information and that makes prices backwards-looking, fundamentally grounded.
Price is what you pay, but value is what you get. — Warren Buffett
Market prices change all the time, and this is generally due to three reasons.
Over longer timeframes,
this is mostly due to our ever-changing opinions about the right price for that marketable security
that is a financial claim on the future value of an underlying economic process
that does not actually change all that often or as quickly.
In quicker timeframes,
prices change thanks to temporary supply and demand imbalances (more on this later)
and most of this is due to somewhat random buy and sell orders hitting the market.
Another reason prices change all the time is because professionals need market prices to change (to be volatile)
so that they can buy-low and sell-high to earn a capital gain over-and-over again.
This can be done in either order.
For example,
we can buy-low first and then sell at some higher price later,
which is called going or being long that security;
and that is the way we should play this game when the broader economic trend is up.
This is what most people think of as investing.
When the broader market trend is down, we can sell a security that we borrow from our broker at some higher price to enter a
short position
and then buy it back at some lower price later to close and return the borrowed shares for a profitable capital gain.
You can only enter a short position in a regular (taxable) brokerage account.
It cannot be done in an IRA.
However, there are inverse security that go up in value when the underlying assets go down in value.
However, new investors should just go to cash or a government bond fund when the bears are driving the broader stock market trend
or are very likely to become the dominate group.
The big problem with both positions (being long or short a security),
is knowing what to do when prices move against that position resulting in a capital loss.
Classic trading dogma says,
keep your operations in-sync with the broader market trend,
plan your trade and trade your plan,
wait for a favorable setup,
and then cut your losers short and let your winners run.
This approach can work,
but it is far easier said than done.
Most new traders go broke before learning to master this classic trading approach.
There are many ways to play ever changing market prices and some have favorable odds,
but others, well, not so much.
So, what should a new investor do?
Lean how to effectively play this game, how to create wealth in the markets,
which is not that hard, and the balance of this paper lays out an approach with favorable odds.
Trading with the trend, with the momentum component of the market, is a classic approach.
Market participants tend to buy securities that are in favor,
what they perceived to be going up,
and sell what they think is going down,
and this behavior tends to push the current trend forward.
But sooner or later, and often just after the trend becomes obvious,
it reverses because that trend is overdone, it is no longer a reasonable reflection of likely future value.
There's another old saying,
"When prices cannot go up on good news, then they must come down."
They've priced in too much of a premium.
So, current market prices are not always a good representation of likely future value and can even be misleading
(e.g., a downtrend can suggest that things are getting worse, and worse as a downtrend continues).
There are times when prices trade at a discount, have been down trending,
because the average market participant is
bearish (pessimistic) about the future;
and there are times when the market is pricing in a premium because the
bulls (optimist) are the dominate group, driving prices higher.
There will be times when these discounts and premiums are really big relative to the broader average price,
which does a relatively good job of filtering out excessive
dispersion
(the variability, scatter or spread in the data).
For example, consider the trading range of any stock over a 52-week period (a year)
compared to a simple 200-day moving average,
there will be a few extremely volatile trades that can occur outside a mostly narrower trading range
(i.e., about 95% of all future trades are very likely to trades occur within
two standard deviations of the 200-day moving average).
A Simple Moving Average (SMA or just MA)
is a far better indication of overall likely future value than any single price sample or even a small set of samples thanks to
Mean Reversion
(A well founded financial theory that asset prices and historical returns
eventually return back to the long-run average or mean).
Unlike a linear regression
line that shows the average for all the data in the sample set (of prices over time),
a moving average will bend and track the data based on the size of the sub-set
and that yields a better (more sensitive) indication of how the data are trending,
it is an automatic trend line.
Market prices naturally trade around their average price and move in the direction of the broader market trend.
Many professionals use three (or four) MAs on their charts.
They prefer a 20-period (a statistical sample size) for shorter timeframes,
a 50-period for intermediate timeframes, and a 200-period for longer timeframes.
Some pros also include a 100-period MA on their daily charts.
Shorter timeframes are quicker, but more likely to be wrong as indicated by longer timeframes and are a lot harder to successfully trade
because market participants are fighting over a relatively fixed amount of economic value.
Longer timeframes are much easier to yield success because they factor in an economic growth component and an operational income component,
some securities will pay you some of what they earn to hold;
and these two components can bring a lot of value (in time) to an investment with a poorly timed entry
(i.e., when an investment shows you a drawdown,
a paper loss, shortly after entering the position).
On average,
about 45% of the total return from the
S&P 500
(the blue-chips)
comes from dividend income.
Too many new investors ignore this source of total return,
and much of this type of income goes to pay the fat salaries of the big mutual fund managers
that like to keep their shareholders focused on the capital gain component of their fund.
Trading is Hazardous to Your Wealth. — A common life lesson
that is generally learned the hard way.
The problem with longer timeframes is that it takes a lot of patience.
Everyone wants to earn a positive rate of return
ASAP,
because quicker profits have a higher rate of return than the same profit earned over a longer period of time.
But earning quick profits is far easier said than done.
It's important for new investors to understand that when they work to generate quick profits,
they are competing with the better professional shorter-term traders operating in that timeframe for that quicker reward.
Almost all new and most retail traders are very unlikely to consistently beat (out trade) the pros at their shorter-term momentum game;
and persistence without the skills and wherewithal required to compete tends to yield a smaller and smaller account.
It's like thinking, I'm pretty good a shooting hoops (basketball) and Michael Jordin says
that I can play him for money on his home court anytime between 9:30 am and 4:00 pm on most Mondays through Fridays.
Expecting to take his money is delusional thinking.
Many have had to learn this lesson the hard way, including your truly;
and most walk away poorer, thinking the markets are a rigged crap shoot.
They simply don't understand what is going on and why.
Thinking that because you are better than average in other aspects of your life
automatically means that you are likely to be better than average in the markets
is just misinformed thinking.
The average market participant is an accomplished professional.
This doesn't mean that they can't make mistakes nor that you can't make money in the markets too.
It means that trading, like many other aspects of life, is all about effective consistently.
It is all about correctly playing the odds.
It is extremely unlikely that you will be able to beat them at their shorter-term trading game.
It is best to just accept that professional shorter-term traders are the best hired guns on
The Street (a nickname for Wall Street).
They are very well trained, have lightning fast systems, tend to work in teams,
generally have an experienced manager to set strategic policy and to enforce tactical discipline;
and, of course, they have a track record of success.
Just like professional athletes that have worked at it for years,
they can command impressive salaries.
So, you are not likely to beat them at their shorter-term momentum game.
However, you can make money by exploiting a side effect of the market's nature.
Shorter-term momentum traders drive the current trend forward into the waiting arms of the bigger,
longer-term professional investors, who do their buying (average in) at discount prices
and selling (average back out) at premium prices booking profits as they go,
and thus cause these normal trend reversals.
It is these two symbiotic professional forces that create these trading ranges.
We can use charts to better understand what the smart money is doing in each timeframe.
A 15-minute and an hourly chart shows what very active day-traders are doing now,
a weekly and monthly chart show what the biggest and best investors are doing with their time,
and a daily chart shows a hybrid view of all market participants.
Competing against the best shorter-term traders is a mistake.
We need to play a different game, a game with better odds.
For example, we can just Dollar-Cost Average (DCA)
into a broad-based, low-cost mutual fund like Vanguard's Total Stock Market Index Fund
(ticker VTSAX) and this is a wonderful way to start.
This approach has very favorable historic odds because it generates a cost basis (the average price per share)
that tends to be below the broader average market prices over longer timeframes
and because it exploits our economic system's natural tendency to grow into the future,
to generate more and more value over time.
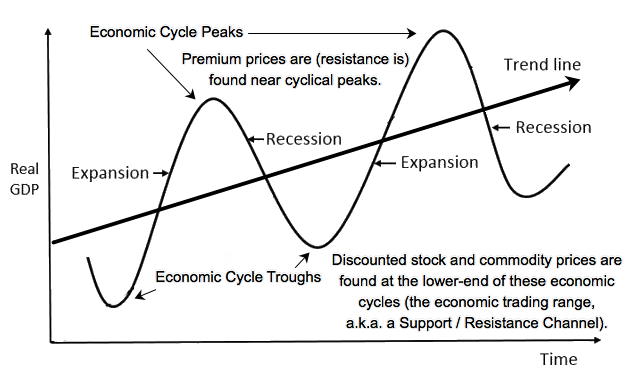
It is not that hard for new investors to grow their savings when they invest (trade) in the direction of
the broader economic (market) trend as indicated by the current phase of the
economic boom-bust cycle,
which is the biggest cyclical trading range (the largest timeframe).
Longer timeframes allow us to factor in the latest economic information that we can apply to normal business processes,
the kind of wisdom taught at universities, in books and in online courses.
The DCA investment strategy is based on a calendar timing (sampling)
technique for a volatile security that is very likely to survive into the future.
But at some point, we're likely to want to be able to keep more of the uptrends and avoid more of the downtrend,
and thus earn a higher rate of return.
Consider improving the results of the DCA strategy by choosing to look at the data,
instead of being driven by a date on the calendar.
We can choose to let our buy and sell decisions be driven by where prices are in the market's broader trading range.
Decide to be more of a buyer when prices are down (lower), and more of a seller when prices are up and when we have attractive profits to harvest.
We can also choose to ignore all other prices.
If you want to be able to earn and keep more of the kind of wealth that longer-term market price cycles can generate,
you simply have to be patient and learn how to see and trade these larger trading ranges,
which is actually not that hard to do, doesn't take much time,
and is a game that almost anybody can win at.
Bull markets are born in despair (in an economic cycle trough)
, grow amid skepticism, mature in optimism, and die amid euphoria (while peaking)
[followed by hope (that the good-times can continue), fear (in recession), and then new despair] — True business cycle wisdom
[(mostly)] from Sir John Templeton [and (extended) by yours truly].
Some have said, and I believe there is some truth to the saying, "Prices are driven by Market Sentiment."
Prices are driven by our beliefs (feelings),
and that propels the trend forward (until it has gone too far).
But there is a deeper truth.
The market is not just driven by feels, like fear and greed.
I believe that the Smart Money uses Market Sentiment
via their market commentary
to motivate the Dumb Money (those less informed market participants)
to buy high (near the top of a broader trading range, like a 52-week high)
and to sell low (the other end of that trading range).
That is,
to buy from the Smart Money when prices are supporting a rich premium
(and it feels like prices are going higher but fail to advance on more good news and commentary),
and to sell when prices are discounted
(and it feels like prices are going lower but fail to stay down on more bad news and commentary).
I've seen this pattern of behavior all my investing life, over-and-over again.
There's a reason why Sir John's admission has stood the test of time.
It is not that hard to learn to see and profitably work this cyclical market reality.
We can learn to invest more like the Smart Money.
 Watch Ray Dalio's "How the Economic Machine Works" on YouTube at
http://www.youtube.com/watch?v=PHe0bXAIuk0 to better understand the big picture
and the economic boom-bust cycle, which is the most fundamental factor driving the value of all investments.
We need to be able to get this right, but it's not that hard.
Watch Ray Dalio's "How the Economic Machine Works" on YouTube at
http://www.youtube.com/watch?v=PHe0bXAIuk0 to better understand the big picture
and the economic boom-bust cycle, which is the most fundamental factor driving the value of all investments.
We need to be able to get this right, but it's not that hard.
The future tends to look a lot like the past,
not always and never perfectly identical,
there will always be some degree of variant randomness;
but similar enough to seriously favor those that can learn from the past,
understand basic business and economics, and can think in statistical terms.
On average and as noted above, professional money managers (big traders and investors,
by virtue of the amount of capital they manage) are responsible for the largest amount of trading volume on any given day
and are considered to be the Smart Money.
They know how to play this game.
Money naturally flows towards the better operators on Wall Street.
They can afford to buy the best real-time information,
and tend to have some of the best
fundamental
and/or technical analysts on their team.
So, the guy on the other side of your trade is likely to be a profession
or a computer programmed by a team of professionals.
I'm not saying that they never make mistakes. They do.
I'm saying those guys are good, and probably way better than the average retail investors (you).
This does not mean that you can't make money too.
You can, if you trade (invest) with (like) the biggest investors;
and wait for Mr. Market to offer up favorable prices, better implied values.
Let Mr. Market come to you.
A savvy investor can wait for favorable prices.
We can use real-time charts to see what the Smart Money is doing now and has done in the past.
(Yes, this paragraph is a little redundant; but that's only because this information is so important and is worth a fortune.)
It pays to understand the big picture and to be able to see the well-informed professional forces driving market prices forward,
to receive the message of the market and to know when that message is likely to be true and when it is more likely to be wrong,
given what we can know about the economy and the market's nature.
In broader timeframes, when the general economic news is good and prices are likely to slowly grinding higher
(like while the economy is growing amid skepticism and then optimism)
or the news is bad and slowly grind lower (hope and fear),
we want to believe that message and trade with that trend.
But, at some point, prices will stop going down on more bad news (while in despair)
or stop going up on more good news (euphoria);
and this is a market message that should not be believed.
The pros are saying one thing but doing the opposite or the guy or gal doing the talking is simply out-of-sync with the broader market.
Beware of
Pump and Dump,
a classic Wall Street tactic that is illegal but still done.
One respected guy or gal will advocate the purchase while everyone else in-the-know is selling.
It is important to understand that the retail participant is generally the last to get the news or commentary.
But everyone can get about the same real-time access to the market data
and we can learn how to receive and process the message of the market.
We can learn how to make our own buy and sell decision based on all that.
 Market prices are always driven by supply and demand imbalances.
Buyers (the Bulls) create demand.
Sellers (the Bears) create supply.
When the bulls are more aggressive
(using market orders to force a trade),
demand can momentarily overpower supply and drive prices up to near-term premium prices that attract savvy sellers.
And when the bears are more aggressive, supply can overpower demand and drive prices down to near-term discount prices,
the bottom-end of the current trading range and that attracts savvy buyers.
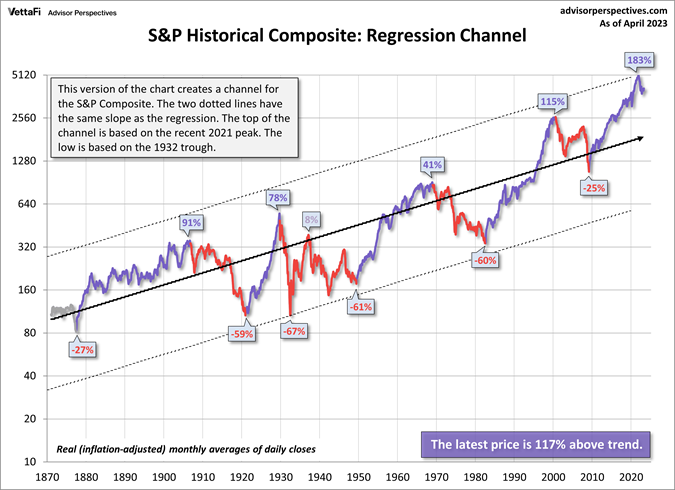
Technicians (chart analyst) call this trading range a
Support and Resistance Channel
that can be seen in charts over various timeframes,
with longer timeframes having bigger channels because when you add time you also add participation and economic information
(i.e., more institutional wisdom).
So, buys below the average price in an S/R Channels (trading ranges) have better odds of being a better value,
and waiting to buy near the bottom of a broader (bigger) channel has even better odds of yielding success;
and that's the game new investors should be playing. It takes a lot of bearishness to drive prices towards the lower end of the broader trading range
where bigger than normal discounts exist.
If we can keep our wits about us and not get duped into foolishly giving our money to other market operators,
we can also make good money in the market by trading against these broader trading range extremes while investing with the broader economic trend
(in-sync with boom-bust cycle).
Retail investors are advised to trade with (like) these big professional money managers (the best investors), use a
limit order
to buy a little above likely Major Support, a level of demand that can reverse the primary (broader market) downtrend
found near the lower-end of longer-term S/R channels,
and be a seller near Major Resistance, the upper-end of this broader trading range as best seen in some weekly charts and on all monthly charts.
Note that it takes a lot of time and bullishness to drive prices to major resistance
and once again we need to keep our wits about us and not get suckered into believing that we'll never see major support again,
which can happen relatively quickly when compared to the run up.
There's an old saying, Prices take the escalator up and elevator down.
We need to develop the ability to harvest attractive market rates of return,
which can be in excess of 10%.
We want to avoid the natural tendency to lose an easily doable, relatively quickly,
and very acceptable 7.5% return by holding out for more like better than 12%, which can happen,
but less often.
What the market giveth, it can quickly taketh away,
which reminds me of another old saying,
"The bulls can make money, the bears can make money, but big and chickens tend to get slaughtered."
Market prices are always driven by supply and demand imbalances.
Buyers (the Bulls) create demand.
Sellers (the Bears) create supply.
When the bulls are more aggressive
(using market orders to force a trade),
demand can momentarily overpower supply and drive prices up to near-term premium prices that attract savvy sellers.
And when the bears are more aggressive, supply can overpower demand and drive prices down to near-term discount prices,
the bottom-end of the current trading range and that attracts savvy buyers.
Technicians (chart analyst) call this trading range a
Support and Resistance Channel
that can be seen in charts over various timeframes,
with longer timeframes having bigger channels because when you add time you also add participation and economic information
(i.e., more institutional wisdom).
So, buys below the average price in an S/R Channels (trading ranges) have better odds of being a better value,
and waiting to buy near the bottom of a broader (bigger) channel has even better odds of yielding success;
and that's the game new investors should be playing. It takes a lot of bearishness to drive prices towards the lower end of the broader trading range
where bigger than normal discounts exist.
If we can keep our wits about us and not get duped into foolishly giving our money to other market operators,
we can also make good money in the market by trading against these broader trading range extremes while investing with the broader economic trend
(in-sync with boom-bust cycle).
Retail investors are advised to trade with (like) these big professional money managers (the best investors), use a
limit order
to buy a little above likely Major Support, a level of demand that can reverse the primary (broader market) downtrend
found near the lower-end of longer-term S/R channels,
and be a seller near Major Resistance, the upper-end of this broader trading range as best seen in some weekly charts and on all monthly charts.
Note that it takes a lot of time and bullishness to drive prices to major resistance
and once again we need to keep our wits about us and not get suckered into believing that we'll never see major support again,
which can happen relatively quickly when compared to the run up.
There's an old saying, Prices take the escalator up and elevator down.
We need to develop the ability to harvest attractive market rates of return,
which can be in excess of 10%.
We want to avoid the natural tendency to lose an easily doable, relatively quickly,
and very acceptable 7.5% return by holding out for more like better than 12%, which can happen,
but less often.
What the market giveth, it can quickly taketh away,
which reminds me of another old saying,
"The bulls can make money, the bears can make money, but big and chickens tend to get slaughtered."
On charts we can see the size of the current trading range in that timeframe,
the direction of the broader market trend, and the health of that trend in that timeframe.
The size of that trading range is defined by pivot highs and lows.
Where an uptrend ends at resistance and becomes the next downtrend is called a pivot high and looks a little like this ∧ on a line chart
(refer to the idealized up and down trend charts).
A pivot low (∨) is formed by a downtrend finding support,
reversing and turning into the next uptrend.
The size of these trading ranges is not always well defined.
These trading ranges are dynamic and are always factoring in new information.
But we can still train our eyes to see them.
They are easy to see in the middle of the chart,
and in time we can develop the ability to see the possibilities in real time as the price pattern develops on the right-edge of the chart.
A healthy trend is likely to continue, and an unhealthy trend is like to reverse.
 A healthy up trend has a pattern of higher pivot highs and higher pivot lows,
and also tend to bounce off a rising 20- and 50-period MA.
A healthy down trend has the exact opposite pattern with lower lows and highs as prices use the 20- and
50-period as near-term resistance.
The pros call this, riding an MA higher (or lower).
A healthy trend also tends to have a little above average volume on the advancing bars,
and a little below average volume on the counter-trend bars.
The extra volume is created by participation of the largest portfolio managers.
The on-balance increase in average volume and bar size is a clear indication of big money moving in or out.
Extreme volume and bar size tend to be signs of a major pivot in the making,
and this is especially true when it happens after a number of (3 or more) bars in the same direction.
Include RSI on your charts
as that oscillator is very helpful in showing when prices have moved too quickly up or down.
RSI above 70% suggests that prices have moved up too quickly and are short-term overbought.
RSI below 30% indicates that the selling is overdone.
Note that RSI can be overdone for far longer than most can stay solvent.
It is best to avoid new longs or adding to existing longs when RSI is above 70%.
Generally speaking, it's also best to avoid new shorts or just selling when RSI is below 30%
as that results is likely to be selling closer to the next pivot low.
Investors want to buy the lows.
Selling the lows should be left to the professional shorter-term traders.
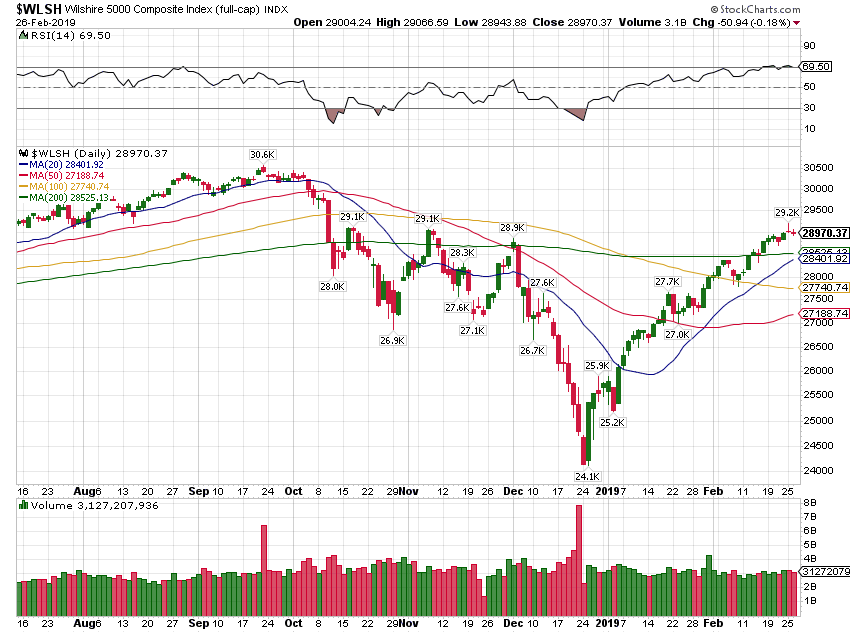
Another sign of an unhealthy trend is when RSI is showing
divergences
with the price action being charted,
prices are up- or down-trending while RSI is show the opposite trend,
indicating that the trend is losing momentum
(refer to the October timeframe in the Wilshire 5000 chart below and the bigger Oct. through Dec. timeframe).
Both uses of RSI can help us to see an unhealthy trend. When RSI is generally moving sideways between 50% and 70%,
that tends to indicate a healthy bull trend,
prices are moving up, but not too quickly;
and when RSI is basing (moving sideways) between 30% and 50%, the bears are active and healthy.
When prices and the three MAs get spread out vertically, that's another classic sign of an unhealthy trend.
It pays to study the historic price patterns for the ticker under analysis in the current and in other timeframes
because the future tends to resemble the past. Develop a feel for what a healthy
and an unhealthy trend looks like for that security,
also for what the average trading range (a.k.a., ATR)
should look like and what it can look like, where prices have gone in the past relative to the 200-period MA on a weekly and monthly chart.
Be patient as it takes time to train the eye, but that wisdom will come and is worth a fortune.
Also note that the size of the current trading range has a natural tendency to contract
thanks to professional trader anticipation
(i.e., getting in front of the competition to ensure a fill close enough to the expected near-term trend reversal, the next pivot).
This price action is likely to continue until surprising news or commentary causes a minor adjustment or a major correction,
thus causing the trading range to expand and/or shift up or down within the next broader trading range.
A healthy up trend has a pattern of higher pivot highs and higher pivot lows,
and also tend to bounce off a rising 20- and 50-period MA.
A healthy down trend has the exact opposite pattern with lower lows and highs as prices use the 20- and
50-period as near-term resistance.
The pros call this, riding an MA higher (or lower).
A healthy trend also tends to have a little above average volume on the advancing bars,
and a little below average volume on the counter-trend bars.
The extra volume is created by participation of the largest portfolio managers.
The on-balance increase in average volume and bar size is a clear indication of big money moving in or out.
Extreme volume and bar size tend to be signs of a major pivot in the making,
and this is especially true when it happens after a number of (3 or more) bars in the same direction.
Include RSI on your charts
as that oscillator is very helpful in showing when prices have moved too quickly up or down.
RSI above 70% suggests that prices have moved up too quickly and are short-term overbought.
RSI below 30% indicates that the selling is overdone.
Note that RSI can be overdone for far longer than most can stay solvent.
It is best to avoid new longs or adding to existing longs when RSI is above 70%.
Generally speaking, it's also best to avoid new shorts or just selling when RSI is below 30%
as that results is likely to be selling closer to the next pivot low.
Investors want to buy the lows.
Selling the lows should be left to the professional shorter-term traders.
Another sign of an unhealthy trend is when RSI is showing
divergences
with the price action being charted,
prices are up- or down-trending while RSI is show the opposite trend,
indicating that the trend is losing momentum
(refer to the October timeframe in the Wilshire 5000 chart below and the bigger Oct. through Dec. timeframe).
Both uses of RSI can help us to see an unhealthy trend. When RSI is generally moving sideways between 50% and 70%,
that tends to indicate a healthy bull trend,
prices are moving up, but not too quickly;
and when RSI is basing (moving sideways) between 30% and 50%, the bears are active and healthy.
When prices and the three MAs get spread out vertically, that's another classic sign of an unhealthy trend.
It pays to study the historic price patterns for the ticker under analysis in the current and in other timeframes
because the future tends to resemble the past. Develop a feel for what a healthy
and an unhealthy trend looks like for that security,
also for what the average trading range (a.k.a., ATR)
should look like and what it can look like, where prices have gone in the past relative to the 200-period MA on a weekly and monthly chart.
Be patient as it takes time to train the eye, but that wisdom will come and is worth a fortune.
Also note that the size of the current trading range has a natural tendency to contract
thanks to professional trader anticipation
(i.e., getting in front of the competition to ensure a fill close enough to the expected near-term trend reversal, the next pivot).
This price action is likely to continue until surprising news or commentary causes a minor adjustment or a major correction,
thus causing the trading range to expand and/or shift up or down within the next broader trading range.
Ideally, the very best time to buy is just after prices have bounced off support (begin to uptrend again)
when the broader market trend is likely to be up
and to sell just after prices have bounce off resistance (begin the next downtrend in the current trading range).
But that is far easier said than done because current market prices (trades) are somewhat random (a little noisy)
and tend to accelerate quickly (as the pros pile in) after putting in a pivot.
Being able to consistently buy the cyclical bottoms and sell the tops is almost impossible, even for the best pros.
Only the occasionally very lucky and liars are able to pull-off this feat.
Assuming that we are in-sync with the broader market trend,
a buy or sell near support or resistance has a very similar Profit and Loss (P&L) profile to the ideal trade
(just after the actual pivot highs and lows).
So, we don't have to get the timing perfectly right, relatively close is effectively as good as the ideal,
when prices stay within the current channel.
The ideal situations get to enjoy a smaller or no drawdown (a shorter-term paper loss);
but virtually all blue-chip and all large, broadly-based mutual funds have drawdowns that reverse in due time,
undoing that drawdown as each group of securities move (trade) through (cycle within) their longer-term trading range,
thanks to mean reversion, which is the more dominate (profitable) statistical property in longer timeframes.
But prices rarely stay within quicker/smaller trading ranges because these quicker S/R channels tend to shift (stair-step trend) up and down;
however, they are very likely to stay within the much broader S/R channel.
The broader market trend is the more dominate (profitable) statistical property in shorter timeframes.
So, market prices trade up and down all the time,
and when we take a position in the market,
the value of that position goes up and down,
tracking market prices up and down.
Everyone would love to be able to buy (enter at) the cyclical low and ride the uptrend to the cyclical high and then sell (exit the position)
or do the short alternative;
but that is just unrealistically.
The best that we can realistically hope to get is a consistent profitable chuck out of every cyclical swing;
but that is also easier said than done.
However, with this insight, some luck and lots of practice we can develop the ability to get more and more of these chucks.
But we still need to deal with those troubling drawdowns, our timing mistakes.
What we really need is strategy to deal with the market's evolving nature.
Professional traders
tend to be some of the best technical analysts and
work to avoid a significant drawdown.
To that end, they trade with the broader market trend,
look for and exploit favorable setups,
and work to carve out profitable chucks of available volatility
within a timeframe that they've mastered;
and when prices break-out of their S/R channel,
they like to let their winners run and cut their losers short
(a stop-loss trade)
thus allowing their winning profits to overpower their losses.
But this is far easier said than done, especially in quicker timeframes.
It is not uncommon for new traders to hollow out their trading account
because they are unable to win more than they lose,
they are unable to Win the Loser's Game
(from the classic investment tome by Charley Ellis, Ph.D. in Economics).
Professional investors are willing to work in longer-timeframes and will bear a significant drawdown that is likely to recover.
To that end,
they do (or buy) the fundamental (and technical) analysis required to understand the broader economic trend (environment)
for their investments.
They work to keep their operations in-sync with the health of the broader market (economic) trend,
only executing a stop-loss trade when the broader economic trend surprisingly turns against their position.
These pros work to reduce their exposure to that trend as the health of the broader market trend shows signs of deterioration.
They are able to use their larger capital base to scale (average) in and out when they need to.
There are times when they are able to work slightly quicker timeframes,
grinding out quicker chunks of available trading range profit.
But when market prices turn against their positions, they start to scale (average) in,
effectively working the market's normal tendency to mean revert over longer timeframes,
and then scale back out as prices recover from the drawdown.
They are able to convert their buy-low and sell-high prices into two averages
that they can manage and optimize.
They work to keep their cost basis (the average price per share) below or as close as possible to the average market price
and book above average or at least available profits as Mr. Market offers them up
and thus free up cash to do more of the same.
Professional investors work the current market to grind out the best available rate of return.
They are able to do this because they have lots of patient capital,
know their investments,
and because they've mastered one or more strategies with favorable odds.
Both types of professionals tend to understand (or at least have a good feel for) their odds of success,
and they work to play favorable odds, just like the big casinos.
Let's imagine a computer system that can track the cost basis for the whole position
and for the various parts therein (open atomic buys for longs or sells for shorts resulting from the scaling-in effort).
The system can track real-time Profit and Loss (P&L) information based on current market prices
so that the portfolio manager can know if they have acceptable profits to protect
or if they have an opportunity to improve their odds of success.
Further imagine that the system is able to assemble on the fly trade recommendations,
target buy and sell prices and quantities, with favorable historic odds for the whole position
and for parts therein using
LIFO or
assigned lot accounting
to optimize the portfolio's P&L profile — cost-basis (the buy-low average for longs),
rate of return (the sell-high average for longs, shorts would have the two order types reversed)
and/or the tax burden.
The system could use AI (machine learning) pattern recognition techniques to identify
and make trade recommendation over the current timeframe trading range
and over appropriate broader timeframes in compliance with the portfolio's strategy requirements.
This recommendation system could also factor in the latest economic and business information.
Computer systems like this are able to standardize and automate their proprietary wisdom and further remove many
negative human traits, like hope, fear, greed and boredom, our biggest archenemies.
Professional teams are able to build computer systems like this.
I know this for a fact,
because I've worked on Wall Street with managers and developers
that have worked on proprietary systems like this,
and I own and have read books that explain how to do this kind of programing.
However, we don't need anything like this to make money.
We can manually leverage appropriate parts of their strategy,
like their ability to create a system that can generate a stream of profits
by effectively and efficiently working the broader market's nature
as pricing cycle up and down within a relevant S/R channel,
the broader trading range moving with the broader market (economic) trend.
We can use a set of relevant chart timeframes to see the broader market trend,
to understand the health of that trend,
and to see where prices are trading now relative to an appropriate longer-term moving average,
and also see where prices can go over our longest timeframe
based on our technical analysis.
We can use this information to setup a trading plan with favorable odds.
One that would have us buy a small part of our position at a likely near-term discount
(a bounce off near-term support)
and target a sell at likely near-term premium
(near-term resistance)
to capture a chuck of that available trading range.
And if price go further down, we can buy a little more at the next bigger resistance level,
and thus giving us the option to lower our profit target for the whole position
when we need to,
and to profitably scale back out over longer periods of time.
We need to use a spreadsheet and an appropriate amount of effort
to do a much simpler version of their more sophisticated computer system.
We can use our spreadsheet to track our trading activities,
our P&L Profile,
and we can use it to play (plan out) "What if" alternatives
based on our analysis of what can and is likely to happen
sooner or later.
The pros have the capital base and skill to build, operate and refine systems like this.
We may never have their skill nor their capital base,
but we can sure learn how to play a much simpler version of their game
(their strategy to generate a stream of profits from available market volatility).
This is a game that we can win at,
especially if we can stay in-sync with the health of the broader economic (market) trend
and wait for trading opportunities with (very) favorable odds.
Yes, it is hard to time these trend reversals, especially in quicker timeframes,
but it's not that hard to get close enough in longer timeframes, and that's where we should start,
on a monthly or weekly chart.
It is easier to be successful working a monthly chart,
but that will require a lot more patience.
But also, a lot less effort.
Plus, that also gives us the time to figure out what works and what does not,
and also how to plan out favorable trades,
if Mr. Market will repeat the prior pattern,
and what we'll do if that pattern fails to repeat,
a simple recommendation system
based on trial and error.
When our shorter-term channel changes,
we can scale in and out over the next larger timeframe,
thus converting our single buy-low and sell-high prices into two averages
that we can learn to manage and optimize,
just like the pros.
Scaling in and out allows us to take advantage of better prices when offered up in longer timeframes.
Unfortunately, we're likely to run out of trading capital way before the big guys do.
But by only buying a bigger discount prices and by focusing on investments that can survive,
we can always exercise the option to just wait for better prices,
and that greatly reduces the need for a stop-loss trade,
a death by a thousand cuts.
The only stop-loss trade we'll take is when the broader market trend (the economic boom-bust cycle)
shows signs of turning against us.
This approach is very effective when applied to investments that can survive volatile market.
But never apply this approach to trades that require you to get it right quickly or face a loss.
Doing that could be a big mistake especially when these unnecessary losses take bigger chunks out of your capital base
(your hard-earned savings).
The ultimate goal is to grow our capital base,
and the best way to do that is little-by-little
and not by trying to hit big home runs that risk a big (permanent) capital loss.
Don't be the guy or gal that has to learn this life lesson the hard way.
It's is best to leave these trades to the pros, those that are able to Win the Loser's Game.
Everyone else should focus on avoiding big mistakes and getting better at converting little mistakes into acceptable winners.
This is a strategy that can favor the small investor.
Once again, we want to focus on a few survivable investments and trade with a healthy primary trend
because a healthy tend is very likely to continue and is an investors best friend
when it comes to turning a near-term paper loss
(a small mistake in a survivable investment)
into a longer-term bankable gain.
Start by learning how to master bigger timeframe,
like the economic Boom-bust Cycle as best seen on monthly and weekly charts, and
then learn how to do it in relatively quicker timeframes,
like on Quarterly Earnings and Dividend Cycles as seen on weekly, daily and hourly charts.
Once we have a successful manual process,
we may even be able to figure out how to create our own automated spreadsheets and/or computer programs.
Professionals specialize.
They get very good at doing something that puts money in their pockets.
We can do this too.
It's amazing what can be done when we focus on and commit to something well within our reach.
Retail investors should focus on a few different securities.
Get to know what you own.
Learn what type of news and economic conditions can drive our securities to profitable extremes.
Pick investments that are very likely to survive, that will pay us a market rate of return to hold,
and that are very likely to see bigger discounts or premiums over time,
thus creating lots of opportunities to buy low or improve our cost basis
and to sell at some higher price, booking profits over-and-over again.
Broad index mutual funds, like Vanguard's Total Stock Market Index
(VTI)
and Total Bond Market Index
(BND),
tend to be very survivable investments because failing issues inside the fund are naturally replaced by new successors.
Most blue-chip stocks can also be survivable investments and should be able to fill a monthly chart;
and if it cannot fill a monthly chart, then it has yet to prove that it can survive volatile economic cycles.
Dissimilar groups go in and out of favor all the time and at different times as the total tradable capital
slouches around the markets take advantage of momentary bigger discounts
and premiums as they come and go.
I can't always tell you which group of similar investments will go into or out of favor next.
But I can tell you for sure that each will go in and out of favor over and over again;
and that if your investments can survive volatile markets and will pay you a market rate of return to hold,
there will be lots of opportunity to buy low, sell high,
and earn income while you wait for your next capital gain, if you simply do what is required.
Be patient, persistent, and play to your strengths.
Do more of what puts money in your account and less of the alternatives.
Focus in on this.
This specialized wisdom can be a real competitive advantage.
It's not that hard to get very good at putting a little money in your account over-and-over again;
and in time, all this can build up a nice retirement account.
Some mistakes are unavoidable,
like perfectly timing the buys and sells,
and others are completely avoidable,
like repeating those strategy choices that tend to yield more loss than reward.
Be the guy or gal that can avoid big mistakes and those avoidable mistakes,
Become that investor that can convert the small (unavoidable) mistakes into acceptable profits over-and-over again,
a skill that can get us to and through retirement.
It is best to think in terms of statistical analysis.
Technical analysis (looking at charts) enable us to leverage our natural ability to see (visually intuit)
the statistical properties
of the data being analyzed.
Our brains are naturally wired to see patterns (in the data),
and we can learn which data patterns put money in our pockets and which do not.
The Smart Money understand that market prices can wander,
but always tend towards mean reversion.
The data generally is spread around an average that tends to move (trend) at a sustainable rate of change.
But when that rate of change becomes unsustainable, it reverses when it has gone too far.
Savvy operators work to play the historical odds for the security they specialize in.
Note that most savvy market investors do their buying at timeframe relative discount prices
and selling at the same relative premium prices based on their superior ability
to analyze all the information available to them,
to effectively operate within that timeframe using time-tested operations (strategies, plans and techniques).
Unless we pay them a non-trivial percentage of our savings growth to invest our money with them,
we'll never get access to their superior abilities.
However, we can learn see the results of their superior operations on charts.
We can learn to trade with them and in time ahead of these big investors.
We are all creates of habit, and we can learn how to anticipate their action.
Think about how we want to play that favorable outcome.
What will we do, if prices go as we expect, and what if they don't?
We can learn a strategy with profitable odds and develop the self-discipline to perfect that approach.
If we track and analyze our operations, we can learn from our results.
The greatest advantage new investors can bring to this game is patience
and an ability to focus on a strategy with favorable odds.
We can wait until Mr. Market offers up
a favorable opportunity, a trade with favorable historic odds.
We can commit to do what it takes to succeed,
and we can also invest in our own skill set.
Learn what works and what does not.
According to James O'Shaughnessy
all successful investing strategies has a favorable value component
(e.g., buy low or at a relative discount)
and a favorable trend component
(like a healthy price up trend and/or a fundamentally slow and steady growth profile),
and I've found this to true.
Start by understanding that it's easy to make money in the stock markets when the economy favors the bulls,
and it's easy to lose money in the stock market when the economy favors the bears
(at these times, it's easy to make money by investing in government bonds).
This is generally true in slightly quicker timeframes too
(a trading range that's a little quicker than the economic boom-bust cycle),
by correctly predicting and trading with the slope
of the longer-term SMA (the primary trend in that slightly quicker timeframe).
But each quicker timeframe is progressively harder-and-harder to trade successfully.
So, first we need to learn how to make money in the market and then we can learn how to make it a little quicker;
and if you find yourself booking more lose more than you make,
go to the next longer (bigger) timeframe and/or take a look at your security selection and timing strategy.
New investors need to focus on a few dissimilar survivable investments that will pay them to hold
as they work to build up the size of their capital base and their market timing skills.
You don't have to be perfect, just good enough.
Work to have the cash to be buyers (scale in) at bigger discount prices and be sellers (scale back out) at premium prices,
booking available profits as Mr. Market offers them up.
Work to capture bigger chucks of the bigger trading ranges.
Persistence in this approach can yield the skills and capital base required to better compete in quicker timeframes.
It is important to understand and accept that when you take a position in the market,
the value of that position is going to go up and down (track) market prices as they go up and down.
We can't control market prices,
but we can sure control when we do our buying and selling, and what we'll buy and sell.
We should also be aware of our discretionary operational costs and work to minimize them.
That is something else within our control.
The less we pay to play, the more we can keep in our account.
Furthermore, just because prices go up or down,
that doesn't mean we have to make a trade.
When we own positions that can survive volatile market process,
we can always wait for better prices
and we can work to improve our odds of success.
Work on what you can control;
and accept what is beyond your control,
like market prices.
Learn how to take advantage of available market opportunities;
and to simply ignore useless prices, assuming survival investments.
Three classic trading strategies.
A classic trend (momentum) trade: Buy (or short) a pull-back into support (resistance) in a broader uptrend (downtrend).
The primary signature is a trip-screen approach
developed by Dr. Alexander Elder in 1985.
The first screen (e.g., in a weekly chart) shows a healthy longer-term trend that we want to trade with.
The second screen (a daily chart of the same ticker) shows an intermediate-term countertrend move,
a reverse trend that is pulling back to a rising (falling) MA.
If there is also a prior pivot S/R level there, then that improves the odds of success.
The third screen (an hourly chart) shows the shorter-term trend is once again moving with the longer-term (primary) trend
(as seen in the weekly chart).
We enter or add to the position after the intermediate-term trend shows signs of coming to an end,
a buying the dip (selling the rips) approach.
In the case of a long, do a stop-loss exit if the entry buy off support fails to hold; and
do a profit exit
when you've realized an above average rate of return (or an acceptable return) in the face like major resistance
or when an appropriate trailing stop takes you out.
In the case of a short, flip the details.
This classic trend trade requires waiting for favorable entry to avoid too many stop-loss exits.
It also helps to let your winners run and to cut your losses short,
but this is far easier said than done.
An enlightened enchantment to this approach is to buy
Relative Strength, on any pullback
(when not overbought);
and sell (short) relative weakness when not oversold.
This trade is favored by the Fast Money professional day-traders and their computers.
They stick with the primary trend until it reverses on them,
and then they cut their losses short and flip their trading bias
(e.g., going from long or bullish to short or bearish).
This driving the current trend into major support or resistance
(trading range extremes)
sets up the next classic strategy.
A classic trading range (swing or mean-reversion) trade: Buy (or short) major support (resistance).
Market prices spend most of their time in a trading range, an S/R Channel, that can expand and contract,
and that can shift up or down in quicker timeframes,
as prices travel along the broader market trend.
This approach works to capture cyclical price swings in quicker (smaller) channels (e.g., in a daily chart) and
in slower (bigger) channels (as seen in a weekly chart of the same ticker).
The primary signature is after a prolonged downtrend (uptrend) the security stops going down (up) on more bad (good) news,
a clear sign that the big money is quietly buying (selling).
These major S/R levels are where the primary trend is reversed.
They're generally found near 52-week lows (highs).
Do a stop-loss exit trade when the entry S/R Level fails to hold.
Do a profit exit trade when prices move to the other end of the trading range.
This is the strategy favored by the big Smart Money professional portfolio managers.
The goal is to carve profitable chunks out of every cyclical swing.
This strategy in longer timeframes (e.g., using monthly and weekly charts)
is ideal for new investors.
The third strategy is called a Breakout
(a new uptrend after a price consolidation)
or Breakdown (a new downtrend) Trade on surprising news or commentary.
This is a trading strategy made popular by Richard Dennis and his Turtle Traders.
As noted above, most prices trade in a range, a basing pattern (a sideways trend),
and this third classic trade has us enter on a break of a narrow S/R Channel (a price consolidation),
ideally on a successful test of the prior S/R level
conversion on the break,
with a profit target much like the first trade above
(i.e., whatever the market will yield)
and a stop-loss on a subsequent failure of the entry test.
Note that many of these Breakout and Breakdown Trades fail
and are just a shift up or down of the current S/R Channel.
The primary reason for a failure to run is
that most market prices have some rationale connection between price and expected future value
and the big moves generally requires a passionate disagreement between two very active groups of professionals,
the bulls and bears that specialize in that market.
The few that tend to work (i.e., really run long and hard)
are already popular momentum trades or just thinly traded stocks
(i.e., not that many shares available to trade)
thus making it easier for the dominate group of pros to push around for a little while.
This is no place for beginners.
Until you've mastered the first trades two above,
it's best to avoid
these breakout and breakdown patterns.
A combination of 1 and 2 above has very favorable odds and should be employed by most retail investors.
Over longer timeframes employ the classic trend trade that is far from major support or resistance.
Then play over quicker timeframes the classic trading range approach that is in-synch with the broader market trend.
While doing so, break-up trading power to scale in and out,
thus converting the single buy and sell trades into
two averages that can be managed and optimized
as trading ranges in quicker timeframes shift up and down.
Let each commitment of trading power work to pull the break-even average into the broader trading range,
thus allowing any move in the right direction to become an acceptable profit.
This approach eliminates most of the classic swing trading stop-loss exits.
Once prices reverse and move again with the broader market trend, we can scale back out,
thus allowing each prior atomic commitment of capital to the position to earn the desired rate of return;
and thus, freeing up buying power for some future opportunity.
These are short-term profits that can be re-invested to realize a compound rate of turn.
Unnecessary stops can be further avoided by focusing our time and capital
on a few dissimilar investments that are very likely to survive,
that will pay a market rate of return to hold,
and that are very likely to see better prices sooner or later thanks to economic growth.
Correctly anticipating the changes is one way to get paid in this business and is called Earning Alpha.
Specializing (getting to know) your investment can be a real competitive edge and will improve your odds of earning alpha,
just like mastering a strategy with favorable odds and working to improve your cost basis and rate of return.
These are all alpha earning skills that we can develop when we commit to learn and do what is required.
Earning alpha is all about the wisdom and skill we bring to the market.
No one is born with it, but anybody can develop it.
Invest in your alpha generating skills as that can pay wonderful life-long dividends.
Another, passive, way to get paid in this game is to focus on investments that can survive
and recover from negative surprises,
are likely to see higher prices sooner or later,
and that will pay an investor to hold while they wait for an acceptable capital gain.
That prior sentence talks about Earning Beta.
Beta is earning the market rate of return.
It is all about being paid to be an owner of an economically sensitivity security,
an investment that can become more valuable in time.
However, the wisdom (strategy) in the sentence that introduced beta is another example of alpha.
Beta earnings can be in the form of periodic income payments, like stock dividends, bond interest, and rent payments,
and/or from interval growth in the underlying business or group of businesses,
like in a stock fund or a REIT.
Earning Beta is realizing the market rate of return.
It is a passive activity that anyone with money can do.
Note that both Alpha and Beta can be a relatively large positive or negative number
in quicker timeframes (any snapshot in time) as price go up and down;
but over longer timeframes,
these numbers tend to average around a positive 10% for stocks and 5% for bonds.
We want to capture the positive numbers and minimize the impact of negative numbers,
another alpha earning skill.
To that end, this requires us to track our market activity
so that we can know if current market prices can be used to improve our odds of success.
We want to harvest attractive or at least acceptable profits.
When you own an investment that can survive volatile market forces,
you can ignore Mr. Market when he is quoting useless (less favorable) market prices.
Furthermore, once we have saved enough capital,
we can break up our trading power and convert our single buy-low and sell-high prices
into two averages that we can manage and optimize as prices inevitably trade further up and down,
through various timeframes along the broader market (economic) trend.
(BTY, all this extra trading means that we also want to do what we can to keep our commission structure as low as possible.
Broker will compete for our business, but they are going to want to see bigger accounts that increase in size over time.
They cater to successful market operators.)
We can learn how to earn alpha.
When we fail at ability to pick good buy-low and sell-high prices
(by making a small alpha mistake),
we can learn how to effectively manage our positions to capture beta
(a different form of alpha skill)
thanks to normal mean reversion of survivable securities over longer timeframes.
This is called earning alpha on top of beta.
We want to be able to continuously book profits,
large or small from capital gains as a result of successful trading
and from income payments from investments we hold.
This ability is key to becoming a
Consistently Profitable Trader (CPT).
A CPT is someone that can dependably generate a profit
(i.e., has the skill to realize more profit than loss on average and over time).
Being a CPT allows our savings to grow at a compound
rate of return, which is the real key to wealth creation.
In time, we may even be able to become a true market professional,
someone that can make their living off their trading and investing (alpha earning) skill.
By three methods we may learn wisdom: First, by reflection, which is noblest;
second is by imitation, which is easiest; and third by experience, which is the bitterest —
Confucius.
It pays well to learn how to play this game.
Joel Greenblatt's
The Little Book That Still Beats the Market
is a quick and simple introduction to value investing.
There is also an audio version, if you prefer that medium.
To learn fundamental analysis and to better understand what you own,
I recommend two video courses from Chris Haroun:
Introduction to Finance, Accounting, Modeling and Valuation and
An Entire MBA in 1 Course,
both offered on Udemy.com.
To better understand technical analysis and the professional trader's perspective,
consider taking
Corey Halliday's
Start Trading Socks Using Technical Analysis, Parts 1
& 2,
and Advanced Technical Analysis, Parts 1
& 2.
A few times a year, these classes are offered at a real discount, generally around the holidays,
a value investor's approach to market wisdom.
Please understand that I make the second recommendation to help you better understand how professional traders use charts;
however, it would be a big mistake to think this information can be used to turn you into the next professional day-trader.
I've seriously looked into this and I now know from insider statistics that less than 5% can get there
when given the best training, equipment and managerial support.
Use this training to make you a better investor, to understand how professional traders see their markets,
and to better understand the message of the market.
Every investment begins and ends with a trade.
Use this technical wisdom to improve the rate of return on your investments by optimizing the entries and exits.
It helps (a lot) to be able to think in statistical terms.
To that end, consider taking a course like
Introduction to Statistics
or Introduction to Probability and Statistics.
I have a number of other web documents that you might want to review.
The first is my Simple Two-by-Four Approach to trading and investing.
The second takes a deeper look into the Economy and Markets
and documents much of what I've learned about trading and investing.
Another is paper on Retirement Planning introduces a set of rules
that can be used to get to and through retirement.
Also consider my page about my Trading Business.
It pays to invest some time and money in your own alpha earning skill set.
Some of this may be redundant, and I apologize for that.
Writing and revising these papers helps me to better understand and remember what I've learned,
need to bear in mind during the trading day to protect myself from the emotional whirlwind that Mr. Market unleashes,
and that may hopefully help you along your way to becoming a CPT and maybe a true market professional.
Stan Benson