My Market Insights and Trading Business
Market prices contain information called The Message of the Market.
By law, every trade is recorded on the ticker tape, a historic record for all to see.
Putting on our statistician hat,
we can look at market prices as a
probability distribution
to get a feel for what has happened in the past;
and therefore how likely prior events are to reoccur in the future,
given that the future tends to resemble the past.
By extension,
the same can be said for the underlying economic and business data that ultimately drive market prices.
So, the message of the market reflects the sum of all that is known or believed about likely future possibilities
and some amount of random noise.
Our challenge is to correctly read that signal while ignoring the noise.
Market prices are both forward and backward looking.
They are ultimately based on backward looking
fundamental factors
(the economic realities) of the businesses and governmental entities that can issue stocks,
bonds and other financial securities
that we can buy, sell and hold in a brokerage account.
Market prices for these securities are also based on forward looking expectations of likely future outcomes,
attempts to anticipate news and the reaction to that news.
On average, market prices are a good indicator of likely future value,
especially over longer timeframes;
but any arbitrary sample is subject to error.
And when anticipatory mistakes are made, prices quickly correct.
 Because market prices are forward looking,
they naturally trade in an uncertain (dynamic) range.
When prices get too high,
become too expensive relative to likely fundamentals (in longer timeframes)
or just current active trader sentiment (in shorter timeframes),
well-informed market participants step in and sell at premium prices, thus creating
Resistance
to higher prices.
When prices get too low, savvy investors and traders step in and buy at discount prices, thus creating
Support
for higher prices.
These Support and Resistance (a.k.a., Demand and Supply
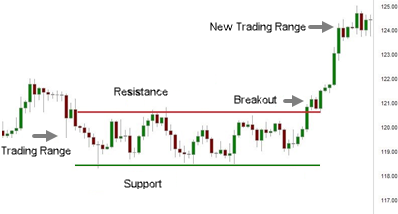
forces created by well-informed traders and investors buying low and selling high define the current Trading Range.
We can see these trading ranges on a Price Chart
(refer to the figure).
It is mostly the range between the highest and lowest prices observed in the timeframe under consideration.
Because market prices are forward looking,
they naturally trade in an uncertain (dynamic) range.
When prices get too high,
become too expensive relative to likely fundamentals (in longer timeframes)
or just current active trader sentiment (in shorter timeframes),
well-informed market participants step in and sell at premium prices, thus creating
Resistance
to higher prices.
When prices get too low, savvy investors and traders step in and buy at discount prices, thus creating
Support
for higher prices.
These Support and Resistance (a.k.a., Demand and Supply
forces created by well-informed traders and investors buying low and selling high define the current Trading Range.
We can see these trading ranges on a Price Chart
(refer to the figure).
It is mostly the range between the highest and lowest prices observed in the timeframe under consideration.
Ideally, we'd like to buy support and sell resistance to earn a capital gain over-and-over again
as prices cycle up and down within the current trading range
as prices trend into the future.
This simple swing trade has very favorable odds.
It can be used to earn a stream of profits
that can be reinvested to earn a compound growth rate or consumed in retirement.
Unfortunately, the current trading range is subject to change and is easily impacted by news and commentary
(as indicated by the breakout and new higher trading range in the chart).
So, we'll need a better strategy to deal with these trading range dynamics (more on this later).
We can use charts to study available economic and market data.
They provide an objective visual mechanism to analyze the economic data and the
Wisdom of Crowds,
to understand the Message of the Markets.
It is important to understand that most of the market activity
(about 70 to 80% of the average daily trading volume) is driven by properly trained,
well-informed, and managed professionals with a clear track record of success.
They are the Smart Money.
We want to develop the ability to see what they are doing and why, and to ignore all the other noise.
Charts show what is happening now, what is historically possible,
and that can give us a feel for the odds that we can project into the future.
They show the trend of the data (the direction of movement),
the health of that trend, and the current trading range
(the distribution of prices around an average) in that chart's timeframe. Monthly, weekly,
daily, and hourly charts are all examples of a chart timeframe and sample size,
where each bar on the chart summarizes the trading that occurred in that sample
period.
Trading ranges exist simultaneously in multiple timeframes
with bigger (longer) timeframes having bigger trading ranges and containing smaller (quicker) trading ranges
that are subject to shifting up (after breaking out) and shifting down (after breaking down)
within their broader timeframe.
These trading ranges have a noisy, erratic, quasi-fractal
(self-similar) relationship.
Furthermore, all trading ranges are subject to expansion and contraction based on trader confidence,
which is always subject to change.
Fortunately, future prices tends to look a lot like the past, rarely identical,
but often similar enough to favor those who study the market for specific tradable securities,
business,
economics and
investing, and
can also project and manage an investment (trading) plan into the future.
 Like most pros, our charts should show volume (the size of the sample),
RSI and
the standard 20-, 50- & 200-period simple
Moving Averages (MAs).
Some pros also include the 100-period on all of their charts,
and some like to see the 150-day MA on their daily charts
(see what works best for you,
but I suggest that it is best to keep it simple and stick with just the standard set).
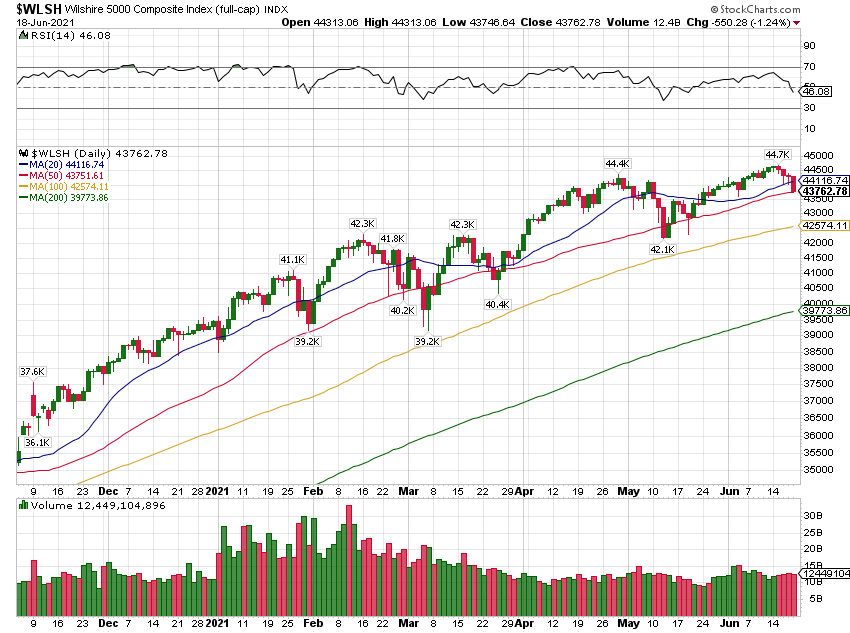
These MAs act like automatic trend lines (refer to the second chart).
The 20-period shows the shorter-term trend and is most subject to error.
The 50-period shows the intermediate-term trend. And the 100-, 150 & 200-period MAs
show the longer-term trend.
These longer-term MAs tend to be better indicators of likely future value.
In bull markets, prices tend to trade above these MAs;
and in bear markets, prices trade below these MAs.
The biggest and best investors, the Smart Money, create bigger (on average) volume;
and mega-volume occurs at and close to trading range extremes,
where the primary trend puts in a pivot reversal pattern.
Like most pros, our charts should show volume (the size of the sample),
RSI and
the standard 20-, 50- & 200-period simple
Moving Averages (MAs).
Some pros also include the 100-period on all of their charts,
and some like to see the 150-day MA on their daily charts
(see what works best for you,
but I suggest that it is best to keep it simple and stick with just the standard set).
These MAs act like automatic trend lines (refer to the second chart).
The 20-period shows the shorter-term trend and is most subject to error.
The 50-period shows the intermediate-term trend. And the 100-, 150 & 200-period MAs
show the longer-term trend.
These longer-term MAs tend to be better indicators of likely future value.
In bull markets, prices tend to trade above these MAs;
and in bear markets, prices trade below these MAs.
The biggest and best investors, the Smart Money, create bigger (on average) volume;
and mega-volume occurs at and close to trading range extremes,
where the primary trend puts in a pivot reversal pattern.
Prices bouncing off an MA and prior
pivots (trend reversals) indicate
Support & Resistance (S/R) levels.
Prices trading near a likely S/R level, based on historic information that we can see on charts,
tend to offer favorable trading odds when trades are made in-synch with the health of the broader market trend.
Minor S/R price levels are where the primary trend stalls or retraces a bit,
as the pros take profits, before resuming the primary trend.
Major S/R levels are where the primary (broader market) trend reverses; and thus,
indicate the size of the current trading range (a.k.a., an S/R Channel).
Major S/R levels can occur anywhere on a chart but are more likely near the top and bottom of broader trading ranges.
We can only know for sure which pivots were major or minor after the fact,
when we see them in the historic data.
However, we can develop the ability to see (more accurately predict) where these levels will develop in the future
based on historic patterns and our familiarity with the security under analysis.
This is one of the primary reasons that the pros specialize.
They get incredibly good at profitably trading just one or a few securities.
We can use charts to analyze the health of the broader market (primary) trend.
A healthy trend is likely to continue, and an unhealthy trend is subject to put in a reversal pivot.
Prices bouncing off one of the standard MAs in the direction of the primary (broader market) trend is a sign of health.
Slightly above average volume on the advancing bars and below average on the retracement bars also signals health.
However, when current prices get too far away from the 20-period MA or
when the MAs get spread out vertically or when RSI gets above 70% or below 30%,
these are all signs of an unhealthy trend.
When trends become unhealthy, this is a good time to book acceptable profits.
Take another look at the second chart.
Can you see the broader market trend? Look at the slope of the green 200-day MA,
which is in a clear uptrend.
Can you see the broader trading range?
This charting system automatically labels the pivot highs and lows,
and the majority of these define the broader trading ranges, major support and resistance.
Notice how this trading range can temporarily expand and then return,
an example of mean reversion.
Can you see the health of the broader (primary) trend and quicker trends?
The 200-period MA shows the broader trend and the price action relative to that indicates health.
The 20- & 50-period MAs show the quicker trends in this timeframe.
The price action relative to these MAs indicates the health of that trend.
Prices trading above and bouncing off an MA is a sign of bullish health.
We see the opposite in a healthy bear market.
Many of the pivots seen in quicker timeframes identify minor support and resistance levels.
When prices get too far above or below the 20-period MA or
when RSI gets to or above 70% or below 30% (overbought and oversold),
these are all signs of trends moving to extremes and are ready to trend reverse,
put in a pivot reversal and then mean revert.
This chart is just a random sample.
We can see this in just about every chart, regardless of the timeframe or ticker.
Recall that all timeframes have a quasi-fractal relationship.
Step one is to develop the ability to see in history (the middle part of the chart)
the broader market trend, quicker trends, the health of each, the trading ranges (S/R Levels),
and then learn to see it develop at the hard right edge of the chart,
where the current bar is developing, to effectively anticipate and profit from the current price action.
 Another professional trading approach that has favorable odds
is to go long tickers that have positive
Relative Strength (RS)
and to short
tickers that have negative relative strength.
All tradable securities can be grouped into indices of related tickers,
like the various Sector ETFs.
Some of these tickers will be leaders and some will be laggards.
Leaders are tickers that are pulling their broader index up
and laggards are those that are holding it back.
(I'm sorry to be a bit confusing,
but on Professional Wall Street a leader can also be a ticker that is pushing down an index in a broader (primary) downtrend,
it has strong relative strength;
however, on TV leaders tend to be bullish tickers because Retail Wall Street has a bullish (long) prejudice (bias).
The professional traders equally favor both bullish and bearish relative strength.)
An index is simply a composite average of the whole group.
An analysis of the various market indices and ETFs can show which group of tickers are performing well now
(are leaders) and which are not (are Laggards).
We can further analyze the individual tickers in each grouping to see
which are leaders and which are laggards in that grouping.
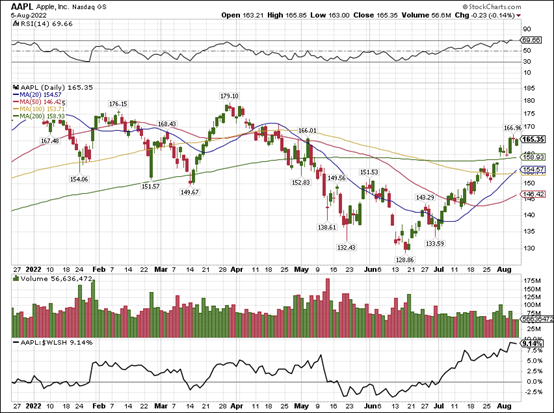
We can simply add a ratio line to our chart to see which tickers have positive relative strength.
For example,
in the chart of Apple (ticker AAPL),
the bottom panel shows ticker AAPL relative to the Total Stock Market
(ticker $WLSH is for the Wilshire 5000 Index and
the colon character between these two tickers means division to create this ratio).
When that ratio line is up trending, Apple has positive relative strength;
when it is downtrend, AAPL has negative RS.
At this time, AAPL is a leader but is also showing signs of being at a possible near-term top
(notice near-term resistance at 166.X prior pivot high in May and that RSI is near 70%).
At this time, we want to harvest some long profits in AAPL.
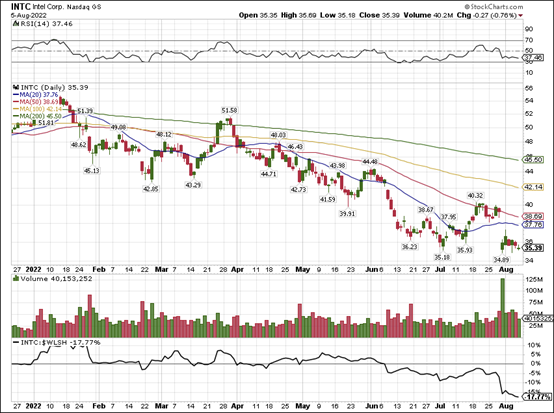
In the next chart of Intel (ticker INTC),
we see that it is a laggard,
but this chart is also showing technical indications that is may be bottoming
(INTC appears to be bouncing off Major Support while RSI is showing bullish divergence).
At this time, we should be taking short profits in Intel,
and thinking about maybe going Long for a quick counter-trend trade.
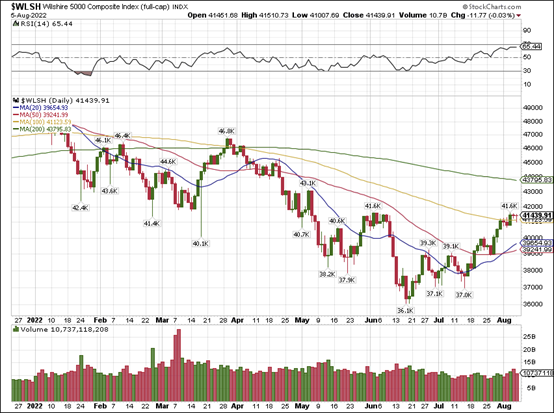
To help in this analysis, here's a chart of Wilshire 5000 Index,
which shows the market in a broader downtrend (a bear market) and in a strong counter-trend rally,
soon to test Major Resistance at the (green) 200-day MA.
You can learn how to read this message of the market;
it just takes time and effort.
When the broader average is uptrending and healthy,
we want to be long a leader;
and when the broader market trend is down or becoming unhealthy on the upside,
we want to be short a laggard.
Another professional trading approach that has favorable odds
is to go long tickers that have positive
Relative Strength (RS)
and to short
tickers that have negative relative strength.
All tradable securities can be grouped into indices of related tickers,
like the various Sector ETFs.
Some of these tickers will be leaders and some will be laggards.
Leaders are tickers that are pulling their broader index up
and laggards are those that are holding it back.
(I'm sorry to be a bit confusing,
but on Professional Wall Street a leader can also be a ticker that is pushing down an index in a broader (primary) downtrend,
it has strong relative strength;
however, on TV leaders tend to be bullish tickers because Retail Wall Street has a bullish (long) prejudice (bias).
The professional traders equally favor both bullish and bearish relative strength.)
An index is simply a composite average of the whole group.
An analysis of the various market indices and ETFs can show which group of tickers are performing well now
(are leaders) and which are not (are Laggards).
We can further analyze the individual tickers in each grouping to see
which are leaders and which are laggards in that grouping.
We can simply add a ratio line to our chart to see which tickers have positive relative strength.
For example,
in the chart of Apple (ticker AAPL),
the bottom panel shows ticker AAPL relative to the Total Stock Market
(ticker $WLSH is for the Wilshire 5000 Index and
the colon character between these two tickers means division to create this ratio).
When that ratio line is up trending, Apple has positive relative strength;
when it is downtrend, AAPL has negative RS.
At this time, AAPL is a leader but is also showing signs of being at a possible near-term top
(notice near-term resistance at 166.X prior pivot high in May and that RSI is near 70%).
At this time, we want to harvest some long profits in AAPL.
In the next chart of Intel (ticker INTC),
we see that it is a laggard,
but this chart is also showing technical indications that is may be bottoming
(INTC appears to be bouncing off Major Support while RSI is showing bullish divergence).
At this time, we should be taking short profits in Intel,
and thinking about maybe going Long for a quick counter-trend trade.
To help in this analysis, here's a chart of Wilshire 5000 Index,
which shows the market in a broader downtrend (a bear market) and in a strong counter-trend rally,
soon to test Major Resistance at the (green) 200-day MA.
You can learn how to read this message of the market;
it just takes time and effort.
When the broader average is uptrending and healthy,
we want to be long a leader;
and when the broader market trend is down or becoming unhealthy on the upside,
we want to be short a laggard.
 Just think:
- In a Healthy Uptrend, be Long and Buy the Dips.,
- In a Healthy Downtrend, be Short and Sell the Rips.,
- When the trend is Unhealthy and at likely Major S/R,
look for Counter-Trend Trades with an appropriate Stop.
- Take some above average profits when Mr. Market presents them, and
- Also take acceptable profits when Mr. Market is signaling a likely trend reversal.
These relative strength trading strategies have very favorable odds.
Ideally, we want to Buy Support and Sell Resistance over-and-over again,
while keeping our operations in-synch with the health of the broader market trend.
In support of this objective, we should use three (or four) adjacent timeframes (charts) when we analyze the market and
plan out our trades, a Triple Screen Trading System,
introduced by Dr. Elder in his classic book
Trading for a Living.
For example: Assume we are trading a daily chart,
we should use the weekly chart to see relative strength,
the broader market (primary) trend, the health of that trend, and
the broader trading range.
We use this timeframe to set our trading bias, long or short.
On the daily, we do a similar analysis.
We want to look for favorable counter-trend setups
(e.g., buy the dip in a healthy uptrend).
On the hourly and maybe quicker chart,
we're looking for opportunities to enter, add to, reduces the size of,
and exit positions.
We need to understand where (intraday and) daily trading ranges and trends are relative to their broader chart details
because quicker S/R Channels tend to surprisingly shift down in their broader S/R channel.
We'll need a plan to deal with that.
Traditional trading dogma says, "Cut your losses short (e.g., when a buy of support fails to hold)
and let your winners run."
However, this is far easier said than done because that forces us to compete with professional shorter-term trades,
a Loser's Game.
Big professional investors prefer to scale in and out (more about this later), and they only use a Stop Loss trade
when the primary trend has or is about to turn on their position,
this can help us win this Loser's Game (refer to My 2X4 Approach below).
Continuing with the example:
We can use the next quicker chart timeframe (hourly chart) to optimize the entry and exit trade.
Assume the primary trend is up on the broader timeframe (weekly in this example).
In the current (daily) timeframe, prices are trending down and approaching likely near-term support
(like a prior pivot high or low and/or a rising moving averages)
and in the quicker timeframe (hourly chart), prices have bounced off support and are starting to uptrend,
we use that to start or add to our
long position (a traditional buy first and sell later approach).
Like professionals,
we want to capture cyclical price swings within these dynamic trading ranges as prices trend into the future.
Keep operations (Long or Short)
in-sync with the health of the broader market (primary) trend.
Because it is hard to consistently buy channel bottoms and sell the tops,
break-up trading capital to allow scaling (averaging) in and out of positions.
Thus, converting the buy-low and sell-high trades into two averages
that can be managed and optimized as market prices cycle up and down in the current and in broader trading ranges.
Book quicker profits when we can and
book acceptable profits when we must work for them by scaling in and out over longer timeframes as channel dynamic evolve.
This will require a proper bookkeeping system that allows us to track our trading details so that we can see our
real-time Profit and Loss (P&L) profile.
To know if current market prices are useful (have favorable odds) or need to be ignored
(it is best to wait for better prices).
Using an appropriate set of charts (refer to Triple Screen
above), this bookkeeping system (e.g., a spreadsheet) should allow us to see
the possible P&L alternatives based on historic chart information and to
plan out each alternative possibility. Work to keep our cost basis (the average
price per share and break-even price for the whole position and for sub
combinations) as close as possible to the broader average thus allowing a
favorable swing to be an opportunity to book an acceptable profit or to
minimize a Stop Loss. These tools and techniques differentiate the true
professional from everyone else in the markets for tradable securities.
When scaling in, it is best to make each addition capital commit have either a bigger vertical
price interval and/or bigger size to better impact the averages.
This approach makes it easier to turn a near-term drawdown
into an acceptable longer-term profit.
Focus on likely Major and Minor S/R levels and trading methods that have
time-tested favorable odds
and that support our natural tendencies.
Savvy investors understand that it is generally best to wait for
Mr. Market to come to them,
to let trend traders push prices to trading range extremes,
were investors have favorable odds of playing a price swing back toward an average
(a mean reversion,
and occasionally to the other end of that broader trading range.
Professionals specialize.
They focus on securities and activities that allow them to maximize profit and
minimize loss as they build a track record of success, and
thus allowing positive compounding to work its true wealth creation magic.
I personally prefer a quad-screen view with weekly, daily, hourly & 15-minute charts,
all with 20-, 50-, 100- and 200-period MAs, volume, and RSI.
This is my normal daily setup.
Once a week or so, I'll include a monthly view too
just to be clear on the biggest picture.
I use these to analyze The Market.
With my planning and tracking system (my spreadsheets),
I use Limit Orders
to target favorable buying and selling opportunities.
When my analysis indicates that a real-time high-odds-of-success setup is at hand,
I use a 5-minute chart with the same technical indicators,
plus a Level II window that shows market depth,
and a Time and Sales window that shows how trades
and Level I quotes are hitting The Tape.
I use this real-time trading setup to optimize my buy or sell orders.
At this time,
I prefer TD Ameritrade's ThinkOrSwim
trading platform because it is free,
plus they also give me an appropriate set of futures
tickers that trade almost all of the time day or night.
I'm happy to give you a copy of my screen layout.
I used to favor Merrill's old MarketPro system,
but they discontinued it and replaced it with an inferior platform.
So, they now get less of my trading business, which I've moved to Interactive Brokers.
There are other very good trading platforms, but some of these require additional fees.
I hate to pay for something I can get for free.
Plus, money not spent on stuff like this can work to fund account growth.
You have to pay to play,
but you don't have to pay too much.
It pays (literally) to become very familiar with these mostly free, broker provided Tools of the Trade.
In time, this iterative analytical process will become second nature,
and you'll be able to just perceive the Message of the Market for the ticker in focus.
You'll be able to Trade in the Zone,
like most professional traders that specialize on an appropriate timeframe and small watch list of tickers.
Like me, you too can become a Consistently Profitable Trader/Investor in your appropriate microcosm.
We can all do this too, if we're willing to work at it.
Wait for Mr. Market to come to you,
use favorable setups to enter, add to, reduce and exit profitable positions as
indicated by historic chart patterns.
Understand that methodical, patient, and persistent use of an iterative analytical
and trade planning system standing on an effective bookkeeping system are all profitable skills
and tools within our control.
But market prices are not.
It is best to profitably trade around a few dissimilar positions that can survive negative surprises
and that will pay you to wait for our capital gains.
It just takes time, money, and lots of disciplined, methodical effort to develop the skill and capital base
required to become a True Market Professional —
that is, someone that can make their living trading the market.
This is a profitable skill set that can allow you to live and work (or retire)
anywhere that has good broadband access to market information.
Here is my key insight.
Predicting future prices is hard, even for the pros.
However, when you specialize and focus on the few dissimilar securities that can survive
and that will pay you to wait for better prices,
and you have an effective charting, bookkeeping and planning system,
then making money is just a function of iteratively (periodically) sampling Mr. Market's price action.
Ask, "Are current prices favorable, given my current portfolio and plans?"
If so, take action.
If not, wait for better prices.
Understand that favorable prices can become more favorable, or they can quickly reverse.
Only make a trade when prices favor your prosperity.
But don't go all in or out. Picking tops and bottoms is hard.
But you don't have to do that to make money.
You just need to be in it, to win it.
You don't have to be perfect.
You just need to buy below your selling price, over and over again.
Again, this will take time, money, effort, some skill, and lots of patience and persistence.
These are favorable skills that you can bring to this game.
Be willing to learn from your mistakes and to revise your plans when presented with new information.
Let Mr. Market do what he will, which is mostly trade up and down within the current and broader trading ranges,
over and over again.
All we need to do is develop a system (like my Simple 2X4 Approach below),
an iterative process, that allows us to see and profit from this perpetual price cycle
as it progresses along the broader market (economic) trend.
Note that much of this iterative effort can be automated
and the reason why so much of today’s trading volume is driven by computers.
My Simple Two-by-Four Approach
My
simple two-by-four approach
to trading and investing introduces two goals and four rules to achieving those goals.
First let me say that we need to always think like an investor
but understanding that every investment begins and ends with a trade.
We want to master the mechanics of trading to improve our long-term investment results.
To that end, I have two goals: A primary and a secondary;
and a set of four simple rules that once mastered make it simple to achieve those two goals.
Our Primary Goal
(is to generate wealth and the best way I know how to do that)
is to maintain Consistently Profitable Trader
(CPT) status.
A CPT is not someone who never makes a mistake or has a losing trade, as the name might suggest.
Simply put,
a CPT can reliably generate more profit than loss over their operational timeframe.
An economic boom-bust cycle, a year, quarter, or a month are all examples of an operational timeframe.
It is easier to achieve CPT status over longer timeframes.
Anyone who fails to realize and maintain CPT status
is very likely to never realize real long-term capital growth of their savings.
A CPT will enjoy positive compound capital growth over time.
Compounding will naturally occur and that will magnify whatever results are realized.
Simply put, our ultimate objective is to grow the size of our brokerage account.
Achieving and maintaining CPT status is key to realizing that ultimate objective.
Our Secondary Goal should be to maintain CPT status in our Optimally Effective timeframe (OET).
We want to make money as quickly as we can.
But avoid sacrificing our primary goal as that will result in compound capital reduction.
Our secondary goal is to realize that growth as quickly as personally possible over time.
Learn and in time master the following rules and you too will be able to achieve the two goals above:
- Focus the bulk of your time and capital on a few dissimilar investments
that are very likely to survive,
that will pay a market rate of return to hold,
and that are very likely to see higher prices sooner than later.
This is my Optimal Stop-Loss Mechanism.
A big chuck of your CPT profit can come from income earned while waiting for a capital gain.
Like the pros,
we want to become a specialist in these securities.
Knowing how these securities support their market value
and seeing how they acted under prior news and commentary
allows us to better predict how they should trade in the future,
and that creates a real competitive edge and the main reason the pros specialize.
- Trade like a professional value investor.
Buy low and sell high to earn cyclical capital gain profits in the current or broader trading range.
Be a buyer only at discount (below average) prices and a seller at premium (above average) prices
or whenever it looks like the market is likely to take back an acceptable profit.
A longer-term moving average on a longer-term chart can help you to see
if current prices are trading at premium or discount prices, or somewhere in between.
And once you have enough capital,
like the big guys,
break that trading power into smaller parts
thus allowing you to turn your individual buy low and sell high prices
into two averages that can be managed and optimized
by profitably scaling in and out.
This too is the professional approach,
and how the biggest and best investors operate.
It's how the pros can grow wealth at an above average rate of return.
- Keep your operations in-sync with the health of the broader market trend.
Simply put, a healthy trend is very likely to continue, and an unhealthy trend is likely to reverse.
This is my Ideal Stop-Loss Mechanism.
Unfortunately, this is far easier said than done;
and if done poorly can results in a violation of our primary goal.
- Maintain a Watch-List,
and an associated iterative analytical and trading methodology.
Using the three rules above,
we want a simple, repeatable process that plays to our natural abilities
to monitor Mr. Market's on-going activities.
This is another time-tested professional technique and
is the best way I know to grow from a Beginner
to a Consistently Profitable Trader
to a True Market Professional.
We want to have a small list of ticker symbols to focus on (specialize in)
and a simple iterative process to
1) find favorable trading opportunities,
2) plan-out each trade and then trade the plan,
3) track Profit & Loss (P&L) details
so that we can know if it is now better to be a buyer, a seller, or to wait for better prices,
and
4) learn from the results.
Mastering this rule is the key to becoming a True Market Professional
(i.e., someone who can make a living in the markets, preferably on their own savings).
Click here to take a closer look at this approach.
Be about the Business of Growing your Wealth
A successful business man or woman needs to understand and manage the following critical aspects of their business:
-
You need to understand the source of your prosperity.
That is,
you need to know your business model and the environment that you operate within
(e.g., the information above).
Simply stated, you need to understand what makes money and what costs you money,
and both need to be managed and optimized.
-
Business operations need to be data driven.
You must understand your numbers.
Which means that you'll need a good set of books.
All profitable businesses have a bookkeeping system.
You simply cannot manage and optimize what you do not track.
Be clear about your break-even numbers, profit margins, and alternatively available rates of return.
-
You need to manage your cash flow,
so that cash (liquidity) is available to meet obligations
and to take advantage of available opportunities.
Unlike a traditional business,
this last aspect is a little less important in the initial wealth creation phase of your retirement business,
while you are building up your capital base and skills
(the wealth and procedures that you'll need to retire upon);
but it is critical in the second phase,
when you are living off the proceeds of this retirement business.
Beware of the Trading Idiot!
Wall Street is very good at transferring wealth
from the impatient, impulsive, and uninformed to the patient and methodical.
Don't be in too big of a hurry to trade
because that's when the Trading Idiot is likely to show up.
It is very easy to get into a position.
But it's not so easy to get out with a profit.
If you are new to all this,
I strongly advise you to take the time to document your analysis with pictures and a description of what you see and plan to do.
This paperwork helps to clarify thinking.
It also allows you to make minor adjustments that can be evaluated,
a step-wise process of improvement.
This effort helps to create the right set of mussel memories that will enable us to quickly do the right things out of habit while the market is open for trading
and our emotions are best able to empower the Trading Idiot.
It truly pays to analyze the market, plan the trade, then trade the plan, and then learn from the results.
Initially,
the first two steps (analysis and planning, with documentation)
and the latter two (trade execution and post trade analysis of the process with appropriate documentation)
will consume most of your time;
but in time as your skills mature and you earn CPT status, the amount of documentation will decrease leaving you more time to grow your net worth grows,
thanks to be a CPT.
Now,
most of my documentation is automated.
I have a python script that downloads all of my charts and a ton of VBA code in my spreadsheets that automate much of the tedium —
my trading details.
I also have a python script that does market data updates in my spreadsheets in near real time so that I can better understand my P&L posture,
to better understand if it is now better to buy or sell or adjust my plans or to just wait for better prices.
I use the current chart set and these spreadsheets to document my plans for likely possible future trades.
It is always best to wait for an entry with favorable odds
or use a Limit Order
to advertise your willingness to trade at favorable prices
as indicated by your market analysis
(e.g., buy just above likely support and sell just below likely resistance).
Do what you must to be a CPT.
Start small, use small position sizes, until you see successful results,
then you can add size slowly.
It's okay to have a big cash account.
The simple rate of return on cash is low,
but don't focus on that.
Mr. Market will offer up favorable (high odds of success) opportunities over-and-over again.
These momentary opportunities can have very impressive rates of return.
But if you have no cash to invest or you're not paying attention to Mr. Market,
then you'll be unable to take advantage of these opportunities.
These critical aspects are very much linked in a hierarchy
and have an iterative process relationship.
Every business needs an understandable, repeatable, and measurable process that can be managed to yield more profit than loss.
Getting good at these aspects is key to growing any successful business.
Start early and have this mastered well before your retirement business enters the second phase of life.
My Daily & Weekly Iterative Business Process
Notice: Some data changes all the time, like market prices as seen on real-time charts,
while other data only changes once a day, week, month, or quarter.
So, I do the analysis at appropriate periodic intervals as the data changes to better understand the evolving message of the market.
Warning: We humans are good at finding evidence to support our beliefs and that reminds me of something I read long ago,
"If you torture the data long enough, it will confess to anything."
I ask, "Do you want to be right, or do you want to make money?"
It's always better to understand the cold, hard truth, and deal with that, than being blindside by reality.
Furthermore,
there is a ton of data and noise coming from Wall Street.
Focus on that information that puts money in your account (the signal) and ignore the rest (the noise).
My Weekly Iterative Process
I use business cycle wisdom and
a weekly update of the Economic Data,
plus a top-down technical analysis of the major market indices
to do my Weekly Review,
which is a Journal (a snapshot) of recent economic and market data, my thoughts about each,
and how all that applies to my trading and investing plans.
I capture the economic data on Friday well after the 4 pm close and do the analysis on Saturday morning of that weekend.
I have I python script that downloads my weekly charts,
and another script that generates a web page report (My Weekly Journal) from this data.
I can then show the latest report on one screen window and a prior report on another.
Thus, allowing a side-by-side comparison.
Working my way through the report standardizes my analytical process.
Seeing and analyzing the change has been very supportive of my ongoing success.
That is, being able to better understand if current prices are likely to be a true or at least reasonable indication of the likely underlying economic grow
or current market prices in need of a correction (a reversion to the mean or even the other end of the broader data spread).
Note that all market and economic data have a natural tendency (a trend component and a spread component — the range of data points spread around a broader trend average).
These are tendencies that we can see, understand, and exploit
(i.e., give us a favorable edge when properly applied in the market).
Based on all that, I set my primary trading bias (bullish or bearish) for each asset class.
We always want to trade in the direction of a healthy broader market trend.
My Daily Iterative Process
On my computer I've set up a file and folder structure that allows me to capture data for each trading day.
This also allows me to store a backup copy of my spreadsheets.
Mistakes will be made.
This data capture and backup process allows me to detect mistakes and recover.
At the beginning of each trading day before the open,
I use SnagIt to take a snapshot picture of the screens for every account.
I do the same for each account after the close,
plus a screen capture that shows all the changes (trades, etc.).
I used these to update my bookkeeping system,
which I also use for analysis, planning, and P&L monitoring.
After 6 pm, I run a python script to download a picture of every chart set in my WatchList,
and then another script to generate a web page report that allows me to quickly view and analyze
the parts of the broader market that I specialize in.
For each item (Candlestick chart)
in my list of Market Tickers
(a.k.a., my WatchList),
starting with the major market indices, and then moving through each tradable issue in all relevant timeframes
(e.g., Monthly, Weekly, Daily & Hourly Charts):
- Establish the health of the broader market trend,
and based on that evaluation I'll select a trading bias:
a) Bullish — look for long positions only,
b) Bearish — look for short positions only, or
c) Uncertain — look elsewhere for better opportunities.
The health of the Broader Market Trend
is indicated by the price pivot pattern relative to the popular 20-, 50- & 200-period
Simple Moving Averages (SMAs or just MAs),
volume, and a momentum oscillator
(like RSI)
on weekly, daily and hourly charts.
Longer-term charts, like monthly, weekly and daily,
should use logarithmic price scaling
and all intraday charts should us arithmetic scale.
A healthy trend has:
- The rate of change is sustainable as indicated by the spread and slope of current prices and these three MAs.
- Prices tend to bounce off the 20-, 50-, & 200-period MAs.
- A healthy up trend has a pattern of higher-highs and higher lows, and a healthy down trend has a pattern of lower-lows and lower highs.
- We tend to see slightly higher volume in those price bars moving in the direction of the broader market trend
then those moving in the counter trend direction, and
- RSI is between 50% and 70% when the trend is up or between 30% & 50% when the trend is down.
- RSI and MACD
are not showing a divergence, a loss of momentum.
An unhealthy trend has one or more of the following:
- Near vertical price movement (a wide range bar preceded by a number of slightly smaller bars
in the same direction) on increasing volume to reach something above the average volume.
This is the classic sign of blow-off top or bottom, which is often followed by a much lower volume (failed) re-test of the prior high or low.
The failure to make a new lower-low or higher-high creates the classic head-and-shoulders reversal pattern.
- RSI is above 70% (overbought) when the trend is up or below 30% (oversold) when the trend is down.
- A divergence between RSI or MACD and current prices.
This is the classic case of the dominant group (bulls or bears) simply running out of ammunition (power)
and that we're in need of a correction before continuing in the direction of the broader market trend.
- A somewhat unorganized sideways movement (a basing pattern),
where current prices and the three MAs begin to intertwine with numerous false breakouts
and breakdowns as volume dries up.
In due time, which could take a lot of time, there will be a real breakout or breakdown,
generally in the direction of the prior broader market trend, on real volume,
with the best entry being on a failure to re-enter the prior basing channel.
- The market or issue is displaying a CRAPpy
[Can't Recognize a (favorable) Pattern] Trading Signature —
It's best to just sit on my hand or go find something else to do.
Trading crappy patterns tends to be a costly waste of time and money.
- Identify the broader market trading ranges, where likely Major
Support and Resistance
(S/R) Levels will present again.
Major S/R levels are where the primary trend reverses.
Minor S/R levels are where the primary trend is likely to stall,
and may pull back a bit, before resuming in the direction of the primary trend.
Major S/R levels are likely to be found near prior pivot tops and bottoms in longer timeframes.
The odds favor trades that bounce off these S/R levels.
- If I see a healthy longer-term trend (I'm able to select a trading bias),
and prices are pulling back into a near-, intermediate-, and longer-term S/R levels,
I'll use these
S/R Price Levels
and a spreadsheet to target and plan out trading opportunities:
a) to enter a new position,
b) to add to an existing position,
c) to reduce the size of an existing position, and
d) to exit an open position.
I'll use my Spreadsheet to Plan Out my trades.
I want to effectively optimize my cost-basis
(the position's break-even and average price) and
I also want to maximize my profits and minimize my losses
(the rate of return from each closing trade).
I'll use a limit order to patiently wait for the market to come to me.
Ideally and assuming that I have the available capital,
I try to have at least two open limit orders for each position,
one to buy and one to sell.
My preference is to fully scale in and out using limit orders,
thus allowing each layer to earn my target (10% +/- 2 points) total rate of return
or whatever that market will offer up.
However, once I have an attractive market rate of return in any part of a position
or the whole position
and if the market begins to threaten that profit,
I allow myself to just take it at-the-market
to lock-in that total rate of return,
to free up the invested capital,
as being a CPT is my primary goal.
I can always use the profitable proceeds to take advantage of the next market opportunity,
thus allowing my profits to grow at a compound rate of return,
the real key to wealth creation in the markets.
For each position in my watch list, I ask (think) about the What, Why, and How of each investment opportunity (ticker).
One could argue that this should be the number one item in this list, but these list items are part of an iterative process.
Plus, the What and Why of it goes into the thought (analytical) process of Watch List maintenance.
- What do I own? (e.g., S&P 500 Index ETF or Apple common stock).
- Why do I own it? (e.g., The S&P 500 Index ETF gives me survivable exposure to the biggest and best U.S. publicly traded businesses.
Apple is one of the best stocks in the S&P 500 Index ETF. It is a very well run business.
Like the S&P 500 Index, it is in a growth market [broader economic uptrend].
Both are volatile, will pay me hold, and should see higher prices sooner or later —
Note that Apple is an even-more-so member of the S&P 500 Index at the risk of being less survivable than the whole index.)
- How do I plan to manage this position? (e.g., I plan to scale in at discount prices, the lower-end of each successively larger trading range,
and to scale back out as prices (acceptable profits) rally to the upper-end of each trading range, over-and-over again.)
Think Benjamin Disraeli had it right when he said,
"The secret of success is constancy to purpose."
It pays to focus on an iterative process like this.
Make step-wise changes that empower process improves
that can be tracked, evaluated, and managed.
I'm willing to give you a copy of my Word documents,
Excel spreadsheets, and my VBA macro toolkit.
I'm even willing to show you how I use these tools in my investment business.
But I don't have time to be your only source of support.
Consider taking Leila Gharani's Udemy class
entitled Unlock Excel VBA and Excel Macros,
if you want to understand and customize the (your) macro toolkit.
Her Visually Effective Excel Dashboards course is good too.
Microsoft Word and Excel are excellent business tools for
designing and tracking your investment business operations.
These two courses can help you create a great set of custom tools
or modify a copy of my tools.
You want to be able to understand the operational basis of your investment success,
and you also want to be able to quickly monitor the status of your investment business.
These tools facilitate these specific business objectives
and the general objective of growing your wealth.
It pays, literally, to learn as much as possible about investing;
and if you can only read one book, I'd like to suggest
Joel Greenblatt's
"The Little Book That Still Beats the Market."
It is a quick and simple introduction to value investing.
There is also an audio
version if you prefer that medium.
To learn more about fundamental analysis and to better understand what you own,
I recommend Chris Haroun's
"
Introduction to Finance, Accounting, Modeling and Valuation" and
"
An Entire MBA in 1 Course", both offered on
Udemy.com.
To better understand the professional trader's perspective, consider taking
Corey Halliday's
"Start Trading Socks Using Technical Analysis, Parts 1
& 2", and
"Advanced Technical Analysis, Parts 1
& 2".
Please understand that I make this last recommendation to help you better understand how professional traders use charts;
however, it would be a big mistake to think this information can be used to turn you into the next professional day-trader.
I've seriously investigated this, and I now know from insider statistics that way less than 5% can get there
when given the best training, equipment, and managerial support.
Use this technical analysis training to make you a better investor, to understand how professional traders
see their markets, and to better understand the message of the market.
Every investment begins and ends with a trade.
Use this technical wisdom to improve the rate of return on your investments by optimizing the entries and exits.
It helps (a lot) to be able to think in statistical terms.
To that end, consider taking a course like Introduction to Statistics
or Introduction to Probability and Statistics.
A few times a year, these Udemy classes are offered at a real discount, generally around the holidays,
a value investor's approach to market wisdom.
It pays to invest some time and money in your own investing skill set.
Stan Benson