My CEF Investment Plan
In this paper I'll walk through the steps I take to plan out an investment in a
Closed-End Fund (CEF).
I'll start with an overview of the basic idea (The Strategy),
then I'll take a look at the fundamentals,
the technicals,
and then I do a trading plan based on this analysis.
In this case,
I'm looking at
Wells Fargo Advantage Global Dividend Opportunity Fund (ticker EOD).
The steps taken here can be specifically applied to any CEF and generically applied to most ETFs,
which are both a type of Regulated Investment Company (RIC),
which is basically a publically traded business that is in the business of investing other people's money
and the purchase of a stock (like EOD) is just taking an equity (ownership) interest the business that issued that stock,
just like every other stock investment.
The Strategy
Preliminary Comments:
Large, mature and diversified CEFs and ETFs
are examples of investments that are very likely to survive and that will pay me to hold.
When I take positions that are in-synch with the health of the broader economic trend,
that gives me the option to avoid most Stop-Loss trades
caused by normal market volatility
and that can actually cause more wealth destruction than is designed to save.
So long as the broader market trend remains healthy,
I can avoid most volatility based losses,
and can actually use that normal market volatility to manage the two important averages.
The first is my Cost-Basis
(the average price per share, which is also the break-even price on the whole position), and
the other is my Rate of Return
(the average Total Return on the whole position or,
if better,
on the various parts of the position).
This approach greatly improve my ability to grow wealth because:
1) it makes it easier to be a Consistently Profitable Trader (CPT),
2) allows my profits (big or small) to grow at a compound growth rate,
and 3) it allows me to take advantage of whatever rate of return the market will yield.
Any trading or investment strategy that requires a likely stop-loss trade greatly reduces my ability to grow wealth
thanks to the compound rate of damage caused by a string of loses.
The best way to create long-term wealth is to harvest a growing string of profits (no matter how small),
thus allowing compound growth to accelerate to the upside over longer periods of time.
Note:
These large, mature, diversified CEFs and ETFs are both able to generate positive cash-flow
and compound growth,
but in two difference ways.
Most CEFs are managed to deliver relatively high levels of Dividends
and Total Return to the owners (the investors) over longer periods of time,
and that cash distributed to the owner can be used by the owners to generate compound growth
by reinvesting those proceed in the best opportunities available;
but as a result of the relatively large distributes,
CEFs tend to have relatively little price appreciation without real economic growth in the
underlying assets.
Most ETFs are managed to deliver Capital Gains while minimizing fees and taxes,
and are therefore able to yield real price appreciation,
but relatively low dividend payments.
ETF investors are still free to harvest ETF profits as they become available to reinvest.
Either way, success in both generally requires buying at relative discount prices
(or building a discounted cost-basis) and selling
at premium prices or whenever acceptable profits have been realized,
given current market conditions.
The Strategy:
Be a buyer of the fund at discount prices and a seller at premium prices
(buy low and sell high)
in the direction of (trade with) the broader market (economic) trend.
Patiently wait for the market to offer up a favorable price (a real discount or premium) before taking action
(refer to the trading plan section below for example details).
Once in a position (an investment), monitor and manage that position.
If prices move as expected,
we're free to harvest acceptable profits or to Pyramid In.
But when prices move against an open position
(the position is underwater and showing an unrealized capital loss),
work that position to manage our cost-basis
(the average price per share),
by Scaling in using bigger and bigger intervals of price and/or size, and of time.
The basic idea is to manage the break-even price by making each additional commitment of capital to the position
significant enough to pull that average closer to current market prices as possible,
thus allowing any move in our favor to be an opportunity to lock-in an acceptable gain
(or to minimize a loss when the broader market/economic trend turns against us).
When prices are moving in our favor (we have a profit to protect) and the current market trend is healthy (likely to continue),
then patiently hold to earn whatever the market is likely to yield.
The basic idea (the ideal goal) is to realize an above average total rate of return that is eligible for the preferred (lower) long-term capital gains tax rate
(the position must be held for at least a year and a day).
However, we should never allow an acceptable total return to turn into an unacceptable loss.
When we have an acceptable profit and the trend becomes unhealthy or market condition turn detrimental,
we need to close or reduce the size of that position to lock-in a gain
and free up capital to take advantage of new market opportunity.
Locking in one profit after another allows our account to grow at a compound rate
when the proceeds are reinvested.
Warning:
-
Because CEFs (like EOD) have high (greater than about 6.5%) payout ratios,
it is very import to only buy at discount prices and
to sell whenever you've realized an above average total return
(the sum of both capital gains plus income earned while waiting for that capital gain).
Please understand that that high yield has to come from somewhere,
and most of it comes from the skilled operations of the managers
(called Alpha on Wall Street)
and the rest comes from the natural wealth created by the underlying assets own by the fund
(called Beta).
The fund managers earn their Alpha and Beta,
then pay their expenses (including their high management fees),
and then they pay out the balance to the owners (the investors);
and if that payout is not covered by the balance (after paying fees and expenses)
then the rest of the value comes out of the fund (the underlying assets),
thus reducing the value of the investment
(see Return of Capital below).
Any investment that supports an above average payout ratio is unlikely to realize much capital appreciation
(see higher prices) because so much of the wealth created by the investment is being paid out to the owners.
This is basically true for all high-yielding investment opportunities.
Buying only at discount prices greatly improves the odds of earning a nice total return.
Being willing to manage your cost basis also improves the odds of success,
and locking in acceptable profits
(e.g., above average total returns) allows you to keep more of what you've earned —
the market both giveth and taketh away value as prices cycle up and down.
-
Please do not succumb to the perfectly natural mistaken belief that
"I am better than average, and all I need to do is out-trade the average other guy in the market."
A belief that Wall Street likes to promote.
Please understand that the average guy on the other side of your trade is likely to be a professional
or a computer programmed by a team of professionals,
who are responsible for well more than 80% of all daily trading volume.
It is very unlikely that you (the average non-professional) are going to out-trade the pros, playing their game, on their home court.
Don't succumb to popular Wall Street advertising and slogans like,
"You can trade like the pros..." and "Cut your losers short and let your winners run."
Very, very few will ever develop the ability to realize success using the popular trading tactics
pushed by Wall Street Talking Heads.
They want you to trade as much as possible
because every time you put on a trade,
they (professional Wall Street) get a chance to feed off your account.
You do have to pay to play, but you don't have to pay too much
(my broker gives me 100 free trades a month, which is way more than I need).
You do have to trade to get in and out of an investment,
but you don't have to settle for current market prices.
Wait for the market to offer up favorable prices.
It's okay to hold a lot of cash.
Only make a trade when the odds favor growing your wealth.
Strategy Application Note:
The basic strategy presented here can actually be applied to any survivable investment that will pay you to hold.
Survivable securities are issued (backed) by large, mature businesses (that have been operating for at least a decade),
enjoy a naturally diverse asset allocation and/or a geographically diversified revenue stream,
are run by seasoned managers with a high degree of integrity,
have a viable business models going well into the foreseeable future,
and they operate under western (GAAP) accounting and legal standards.
Once again, large, mature mutual funds (like some CEFs and ETFs) are excellent examples of survivable investments because of their diversification
and the fact that they have a long record of success.
But that high degree of diversification is a two edge sword.
Sure the diversification offers protection on the downside;
but at the cost of reduced upside opportunity too.
Furthermore, because of the high-yield offered by some CEFs, there is an even greater potential reduction in capital (price) appreciation.
There are more volatile alternatives.
Many ETFs offer a similar high degree of diversification with a higher degree of volatility,
but the yields are often very small thanks to the fact that much of that beta component goes to cover the fund's expenses,
like fat management fees.
There is an even more volatile alternative that offers a similar degree of survivability with yields ranging from about 2 to 5%.
These are securities issued by some of the largest blue-chip companies in the world,
and may be even better opportunities when they are purchased closer to their long-term lows (trading at a big discount) and
seem to no longer go down on bad news.
These mega-businesses have the wherewithal to survive and fix whatever problem is causing the current price discount.
They also tend to operate their business as a portfolio of business opportunities;
and unlike traditional mutual funds,
which are only allowed to own a very small percentage of any one publicly traded securities,
these mature high-yielder are permitted to focus more capital on any legal (non-criminal)
business opportunity that is consistent with that company's controlling documents
as interpreted by that company's senior managers, the board of directors, and (when necessary) the courts.
The following information can generally be applied to any survivable investment.
Specifically,
the macro fundamental analysis, the technical analysis, and the planning are directly applicable;
just understand that more volatile alternatives require bigger intervals of price and time when scaling in and out.
The only real exception below is the micro fundamental analysis
(the specifics of how the business makes money and how well they are doing —
in fact the latter part [their operating results] are the hardest to analyze and the easiest to manipulate
and mostly involves studying their quarterly reports and related news and commentary)
and that is why we have the hard requirement that these businesses must be large and mature,
and thus attracting a large group of independent investment professionals who can do much of that work for us —
we can use them as our watch dogs
(the primary rationale behind technical analysis).
The Fundamentals
Let's start by taking a look at the fundamentals
backing an investment in EOD.
Ultimately, it's the fundamentals associated with this business
(a closed-end mutual fund)
that will determine the likelihood of a capital investment being properly rewarded for risking a position in this issue —
the Beta of our investment
(Beta is systematic market risk, which can be simply thought of as general exposure through Wall Street to the broader economy).
There are trading techniques (addressed below) that we can apply to an investment in a fund like EOD to improve the odds of success —
the Alpha of our investment.
Where do I go to find information about the fundamental story?
-
 I always start with the macroeconomic (long-term) trend.
The most fundamental factor affecting every investment is
the current phase of the Business Cycle.
The economy naturally cycles through boom-and-bust (recovery-and-recession) phases.
Riskier securities (investments) like equities (stocks) and corporate debt (bonds) always do better when the economy is in recovery;
and defensive issues (securities) like government bonds always do better when the economy is in recession (busted).
Note that securities are forward looking instruments; and
prices actually move in anticipation of economic news, and correct when the news and commentary does not support the price movement.
I always start with the macroeconomic (long-term) trend.
The most fundamental factor affecting every investment is
the current phase of the Business Cycle.
The economy naturally cycles through boom-and-bust (recovery-and-recession) phases.
Riskier securities (investments) like equities (stocks) and corporate debt (bonds) always do better when the economy is in recovery;
and defensive issues (securities) like government bonds always do better when the economy is in recession (busted).
Note that securities are forward looking instruments; and
prices actually move in anticipation of economic news, and correct when the news and commentary does not support the price movement.
Successful investing is anticipating the anticipations of others. —
John Maynard Keynes.
The best single (simple) indication I've found comes from the Economic Cycle Research Institute (ECRI),
it's their Cycle Dashboard,
which simply shows the current level and direction of economic growth and inflation.
They also provide other free public indices for the U.S. Economy
(like their Leading, Coincident & Lagging Indices).
Leading indicators, like stock, bond, & commodity prices, predict changes in the economy,
which consistently turn before the economy does,
but are not always accurate (e.g., getting a permit to build a home, but that does not does not mean the house will be built).
Coincident indicators occur (change) at approximately the same time as the economic condition they track (e.g., hours worked and material purchased to build the house).
Lagging indicators follow an event and signify completion (e.g., getting a Certificate of Occupancy for that new home indicating that it is now built and safe to live in).
Refer to Beating the Business Cycle for more information on ECRI's data.
Click here
to learn more about Leading, Lagging and Coincident Indicators.
Another great best source economic data is from www.TradingEconomics.com.
Refer to The Trader's Guide to Key Economic Indicators
for information on how to understand all this economic data.
Unfortunately, the economic data is always backward looking and subject to revision;
but fortunately, the economic trend is very slow moving
and very likely to continue for many months and even years
until the news in the popular media cannot be justified by any rational economic reality
(e.g., a bull-market uptrend will end after growth rates have risen to an unsustainable high,
interest rates have risen to levels that make top-quality bonds a better risk-adjusted alternative to equities,
and great news fails to usher in yet another new market high;
and a bear-market downtrend will end after equities have been priced for Armageddon,
interest rates are effectively zero and underperforming top-quality equity dividends,
and more miserable news fails to deliver yet another new market low).
There are the two very important things that need to be understood about investing with the health of the current economic trend.
First, the (red) stock market cyclical trend always leads (anticipates) the (green) economic trend (as seen in the figure below);
and second, you don't have to catch (time) the actual turn in the economic,
just keep your investment allocation in-synch with the broader economic trend
(here's the tell —
if your investment keeps losing money (no matter what you do),
your investment is simply not in-synch with the broader market trend —
get out and find a better place to invest your money).
Right now, we're in weak economic recovery mode.
Interest rates have only increased a little bit in anticipation that the Fed will do that next —
in fact the Fed has yet to start or even talk about starting.
Bottom line: This should be a good time to invest in risker issues, like EOD.
-
Now let's take a look at the microeconomic situations
(i.e., how the business makes money and how well it is operating that business).
As noted above, EOD is a Closed-End Fund,
a business that is in the business of investing other people's money.
I like the Closed-End Fund Association's web site (www.cefa.com),
click here to see their web page for EOD;
and from this web page I was able to find a link to the fund's web page —
click here
to download a copy of the June 30, 2013 fact sheet, which I found there.
I also like www.Morningstar.com (a great place to find top-quality, standardized information on any stock or fund),
click here to see their web page for EOD.
If you're going to invest in CEFs, you need to become familiar with the standardized information offered on these two sites.
BTW, I like www.dividend.com to current dividend information.
The following is a list of CEF investment attributes I like to look at:
-
Fund Objectives/Strategy:
If we expect to make money on an investment
(in this case the stock EOD,
which is a security issued by a RIC —
Wells Fargo advantage Global Dividend Opportunity Fund),
we should understand how this business makes money and what they do with the money they make.
Will the operations of this business (the RIC) be able to support the expected return?
I like to start by looking at the fund's Objectives —
"The fund's primary investment objective is to seek a high level of current income.
The fund's secondary objective is long-term growth of capital." —
this information was pulled from the RIC's web page,
which also provided a statement about their Management Philosophy or Strategy —
"Invests in global equities with an emphasis on companies with attractive dividend policies and/or those with the potential to grow their dividends over time.
Focuses on companies in the utilities, telecom and energy sectors.
Employs dividend capture and options overlay to increase distributable income."
So what does all that mean?
First understand that these statements come from the
Prospective — a legal commitment to the owners of this company,
which is registered with the SEC and cannot be changed with investor approval.
Second, the managers of this business are going to invest the fund's capital in securities that pay a high yield
(companies in the utilities, telecom and energy sectors, who's growth is very much dependent on the local economies they serve),
they will do their buying and selling in such a way as to hopefully capture the natural moves associated with run-ups prior to the
Ex-Dividend date and sell-offs that follow that date,
which means the fund is likely to generate a larger than normal
short-term capital gains tax bill for the investors at the end of the year
and might be a better candidate for a tax-sheltered account like an IRA
[at this time there is a lot of negative media coverage about dividend capture strategies
and this could account for some of the underperformance between the fund and the fund's class],
and the managers can also sell Call and Put Options to earn extra premium income
[a professional strategy whereby the fund managers sell Call options on the underlying security
when it is trading just below resistance (a price range where seller outnumber buyers),
with a strike price just out-of-the-money;
and sell Put options just above support
(a price range where buyers outnumber sellers),
with the strike price just out-of-the-money —
in both cases the options are likely to expire worthless allowing the fund to keep both the premium and the stock
(in the case of the Call);
but when the options are exercised, the fund is getting paid to buy low and sell high —
please understand that this is easier said than done and best left to professionals].
Bottom-line: This is a professionally managed investment business (a RIC).
The managers will use industry best practices to generate income to distribute to the investors of the fund;
and, if need be, they will sacrifice capital appreciation —
the only way we should expect see higher prices in EOD is when the economics associated with fund's investments improve.
At this time, most of the fund's assets are non-US equities (see Asset Allocation below).
We're going need to see real global GDP growth to see capital appreciation (higher prices in EOD).
We're just now (hopefully) starting to see a recovery in global growth.
We may be a little early
(these things are hard to time and one of the reasons we want to average in);
but we're also going to get paid a very nice (about 10%) yield while we wait for our capital gain.
- Premium/Discount:
CEFs can trade at a premium or discount to the fund's Net Asset Value (NAV).
The price of stock (CEF) can trading above or below the NAV of the assets in the fund.
Most CEFs trade at a discount
(I will not bore you with the reasons here, but we can talk about this later, if you'd like).
A few, like most of those CEFs from PIMCO, trend to trade at a premium.
Here's the main point to understand — each CEF has a mean (average) premium or discount;
and the only real question should be,
"Are current prices above or below that mean?"
Thanks to the concept (theory of) Reversion to the Mean,
price should in time move back toward the mean.
What is important to understand is that CEF prices will vary around some average discount/premium value as the underlying cyclical economics for the fund go in and out of favor.
It's best to buy when current prices are below the average and maybe sell when they're above that average.
MorningStar.com has a proprietary
Z-Statistic that makes it easy to see the current status;
a positive number indicates the current price is trading above the mean, a negative number indicates prices below.
It's not uncommon to see values at or a little above +/- 1; but numbers greater than +/- 2 occur less than 2.25% of the time.
At this time, EOD is trading with a 1-Year Z-Stat of -2.05 — a buy!
- Income Only Yield versus Distribution Yield:
Income Only Yield is what the assets in the fund earn over time (a Beta attribute).
The Distribution Yield is what the fund managers pay out to the fund investors on a regular basis.
We only seem to find this format on www.cefa.com.
The difference provides a handy measure of how much of the fund's distribution comes from investment income, net of expenses,
and provides a quick gauge of how secure the distribution yield is.
For example:
If a fund earns $1.00 (say 10% on a $10 NAV) per share in net investment income and pays out $0.90 (9%),
then you can quickly see the fund can easily cover its payments to the fund's investors
(and the fund will likely trade at a premium).
But if the fund earns only 10¢ (1%) per share and pays out $0.90 (9%),
then the fund managers have to work harder (earn lots of Alpha) to cover the 9% payout ratio;
and when they fail, they'll have to dip into the fund's capital (do a Return of Capital),
which lowers the NAV of the fund
(a prime reason for a fund to trade at a discount).
At this time EOD has an Income Only Yield of about 10% and a Distribution Yield of about 11% (currently 21¢ per share);
so it should not be that hard for the fund managers to earn the balance needed — a good sign.
- Undistributed Net Investment Income (UNII):
UNII represents the life-to-date balance of a fund's net investment income less its distributions.
It's the industry standard way of looking at the payout ratio (Income Only versus Distribution yield above).
A positive number implies the fund is out-earning its current distribution level,
a good thing;
and a negative number is the opposite and when the problem persists,
that generally means a cut in the distribution yield is likely.
It's best to focus on the UNII trend from month to month;
unfortunately, this information can be a little hard to find for most funds.
The absolute level of UNII can be found on www.Morningstar.com
(for EOD, it's -0.0005, which says the manager are almost able to cover the distribution).
You can get the UNII trend from Morningstar and Bloomberg,
but you'll have to pay for it.
Some funds are good about reporting the current UNII level on their web site.
No such luck for EOD.
Most of the pros I know like to focus on the UNII trend because that can —
they or their firm have a Bloomberg subscription
(a Bloomberg terminal is very expensive and all these monthly expenses have to be overcome just to reach break-even,
so I don't have one).
You can, however, capture and plot the current levels reported by Morningstar over time.
Personally, I don't bother with this (at this time)
because I'm primarily focused on managing my cost-basis relative to the current trading range,
which is, unlike UNII, something that is more within my control.
Furthermore, UNII tends to be more import for bond fund because they tend to trade their underlying assets less often
and the UNII trend for bond funds can be a good indication of what's happening to the less liquid parts of the fund.
Thanks to deeper and more liquid markets,
equity fund managers are better able to trade not only the underlying stocks, but also derivatives on those asset,
so the short-term UNII trend is likely to be more volatile and may not be a good longer-term indication of total return.
I tend to rely on PIMCO for my bond CEFs because they're very good at managing UNII
and the primary reason (I think) their funds tend to trade at a premium,
when most CEFs only trade at a discount to their NAV.
- Dividend Frequency:
Most CEFs pay dividends on either a quarterly or monthly basis.
There are two points to consider on this regard:
1) Prices naturally cycle up and down around the Ex-Dividend date, thanks to dividend capture strategies,
and 2) dividend payments actually cost the fund administrative overhead.
So monthly payments give investors more opportunities to buy low and sell high,
but frequency reduces the Income Only Yield of the fund. EOD pays Quarterly dividends.
- Leverage:
Fund leverage comes from borrowed assets or the use of derivatives.
Leverage will enhance the returns of the fund, both positive and negative;
and the use of leverage cost the fund money, which reduces the Income Only Yield of the fund.
CEFs that use little to no leverage are naturally less volatile and less risky.
It's best to only invest in funds that use leverage when the underlying economics (the business cycle) favor the fund manager's investment strategy.
EOD uses no leverage; and is therefore less risky.
- Portfolio Asset Allocation:
Because CEFs are actively managed portfolios, which can change at any time, it is hard to know the current asset allocation.
The government (SEC) requires that the fund's asset allocation must be reported quarterly;
but by the time we see it, it's often a month or two after the fact.
If we look at the last report (on Morningstar) we see
5% Cash, 28% in US Stock, 52% non-US stock, no Bonds, and the balance is Other,
which tends to mean derivatives.
Click here to see the latest (7/31/2013) detailed report.
- Portfolio Turnover:
Because CEFs are actively managed funds, they will tend to have higher turnover rates.
As a general rule, I prefer to avoid fund with rates much above 75%.
Higher rates could lower the Income Only Yield of the fund because trading costs money.
EOD's turnover ratio is about 63%, which is high, but not too high for a fund that employs a dividend capture strategy
and that rate could be about right for a 90-day holding period,
which is needed to qualify for the favored dividend tax treatment.
But we should never let the tax tail wag the investment dog —
when it's time to sell
(e.g., you've reached your target price and/or the market is turning bearish on a bullish trade),
it's generally better to pay a higher tax on any gain and have that cash to take advantage of new opportunities
than to have that capital tied up in a position heading the wrong way.
Bottom line:
This fund is run by a team of professional managers
and we need to give them the freedom to exercise their judgment;
and we also need to track the fund's Total Return
over time to know if the managers have the skill needed to generate value in the current economic environment.
- Management Fees:
On one level, lower fees are better as that leaves more for the fund investors;
but on another level, it is import to understand that good managers have to be paid well to be retained.
Ultimately, the Fund's Total Return over time is a far more import factor and is necessary to justify higher fees.
I mostly use this for comparison to similar funds.
EOD has a 1% management fee, which is not bad for an actively managed fund.
Note that most web sites include management fees in the fund's expense ratio (below).
- Expense Ratio:
On most web sites Expense Ratio includes Management Fees (above).
On www.cefa.com
they give each value and the difference is administrative overhead.
Lower expense ratios are always better and it's good to use this value for comparison to similar funds.
Actively managed funds naturally have higher expense ratios because it cost money to earn Alpha on Beta.
I hate to pay more than 1.25%; but once again,
higher fees must be justified by a higher sustained Total Return.
EOD has a 1.1% expense ratio, which is not bad.
Return of Capital (ROC):
All investment go up and down over time and not always according to plan or schedule.
There will be times when a fund will under-perform and out-perform targeted objectives.
Many CEF managers use a Return of Capital to smooth out these variations in performance,
and this is basically a good thing because investors like receiving a regular (dependable) distribution
(a key component of Total Return).
As noted above,
these funds generally need favorable economic conditions to grow NAV,
which is normally required to see higher average market prices —
capital appreciation (the other key component of Total Return).
If the fund managers are unable to meet their growth targets over a number of months and quarters,
these high-yielding funds will lose value (realize a reduction in NAV) because of the ROC,
and that is a bad thing.
If Return of capital is still a bit confusing,
Morningstar has a good set of slides on the subject.
The pros like to say,
"Avoid funds that do ROC and have a negative UNII trend!"
But once this trend becomes clear,
the fund tends to be closed, merged or brought under new management.
Unfortunately, it's not that easy to know beforehand which funds will do good or bad ROC.
For this reason,
I believe it is very import to only invest in funds that:
- Have been operating for many years,
enjoy a naturally diverse asset allocation and/or a diversified revenue stream,
are run by seasoned managers with a high degree of integrity,
and have a viable business models going forward.
(i.e., thus have a strong indication of survivability),
- Begin new positions at below average discount prices, and
- Be prepared to effectively manage your cost-basis (scale in — average down the position's break-even price) when better discounts are offered,
thus making it easier to realize an appropriate capital gain
(or at least be able to get out with a small loss)
in the next cyclical upturn.
As far as I'm concerned,
the easiest way to know if the fund's return of capital is good or bad
is to just look at the NAV trend (is it up or down?),
which can be seen on the "Growth of $10K" chart
on www.cefa.com
(refer to the figure below,
EOD's red "Fund NAV" line is above the blue "Fund Mkt" price line up,
which shows the CEF is trading at a discount and the NAV is trending up,
both good;
but this fund is underperforming the CEF's class,
which is normally a bad thing,
but this might be due to correctable issues and that could be a good thing).
Taxes:
High-yielding CEFs are targeted towards large institutional concerns that need a high and predictable rate of return to meet their continuing obligations.
This feature can also be attractive to some retirees who have the same need.
When the fund managers are unable to meet their high payout commitments,
the balance of the payout is considered a return of capital,
which can be used to reduce your cost-basis (the amount of money put into the investment).
Individual investors are only liable for taxes on the non-Return of Capital part of the dividend payout
until the sum of all Return of Capital payments reduces the investment's cost-basis to zero —
it is theoretically possible to earn a high-yield on an effective zero cost investment.
However, once your cost-basis becomes zero, all subsequent dividend income is taxable.
Note that any reduction in the cost-basis also affects the capital-gain calculation when you sell the investment.
Furthermore, if your dividends are taxed at the higher marginal rate, like all REITs,
a Return of Capital transfer from the shorter-term dividend tax rate to a more favorable longer-term capital-gains rate may be a wise tax strategy worth
considering when that dividend income is taxed at the higher rate.
Alternatively, if investors would prefer to avoid all this extra accounting, they can just teat all the distribution yield as dividend income.
The IRS says the individual investor can decide to go either way on a per investment basis; but once an accounting method is started, it can't be changed without IRS permission.
Longevity:
In theory, these funds, like any other non-proprietorship business, can live forever; but in practice, they rarely do.
Their operations will one day come to an end for one reason or another (generally for poor management performance).
When the managers decide to end the fund, generally speaking, one of three things is likely to happen:
1) The fund is liquidated (the final NAV is established) and that capital is returned to the investors.
2) The fund (CEF or ETF) is converted to an open-end status,
which gives the investors a chance to cash out on the next 4 PM closing NAV price.
3) The fund's assets are merged with the assets of one or more similar funds run by the parent company;
and thus your investment is converted to a new position in the newly constructed fund.
In the first two cases, if the fund was purchased at a discount to NAV, there could be a capital gain realized from the elimination of that discount;
and in the latter case,
you'll once again need economic growth and/or to manager you cost-basis to realize an acceptable Total Return.
And finally, these CEFs will sometime do a Rights Offering to raise more capital.
When this happens, current prices will tend to sell-off because of the real fear of dilution
as current investors are given an opportunity to buy more shares from the managers at a below market discount.
Don't become overly alarmed.
If the fund has good managers,
any short-term loss of value (market prices) should be recovered in time;
and if you're able take advantage of the offering,
there's are real opportunity for a quick capital gain as prices often recovery to a new, higher trading range after all is said-and-done.
The longer you plan to hold (or have to hold to reach break-even, your cost-basis),
the better the fundamentals need to be.
Never ignore the fundamental story.
Only invest in securities that are backed by good fundamental stories, looking forward.
That is, the manager's strategies are in-synch with the current economic cycle trend;
and when that economic trend turns against your position,
close that position or at least reduce the size of that position.
Ideally, we want to enter and hold a position in a high-yielding security like this
for the lion's share of an economic up trend;
that's how the big money is made in the market.
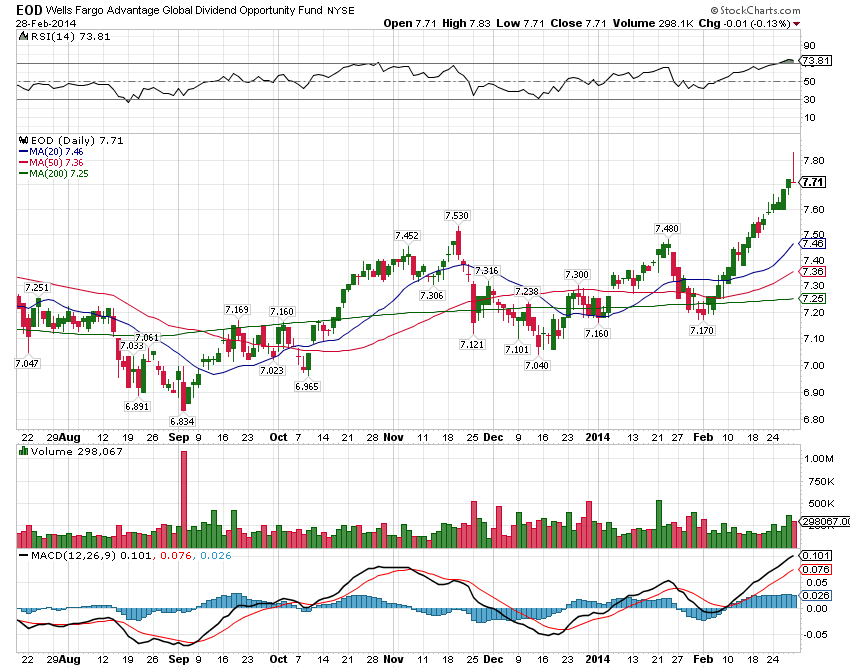
The Technicals
Let take a look at the Technicals — the Charts.
In the following daily-bar CandleStick chart
(from www.StockCharts.com,
which includes standard RSI,
20-, 50- & 200-bar Simple MAs,
& MACD)
I see the following:
- An objective moment-to-moment streaming interplay between buyers (who create demand)
and sellers (who create the supply of stock for sale).
Every time a trade occurs, a print hits the tape (a legal record of all trades) marking the ticker symbol, time, price and number of shares traded.
This streaming data can be aggregated and analyzed on a chart,
where each bar shows the initial trading price, the highest price, the lowest, and the last price for the sample period (in the chart below, each bar or sample period is one day).
Note that the same streaming trade data can actually be analyzed on different time scales —
for example, we can see trading on a 15-minute chart, an hourly chart, a daily chart, a weekly chart and so on.
The more time we add to the chart,
the more participation we include.
Quicker charts tend to show us what the day-traders are doing;
and longer period charts show us what the big professional money managers are doing.
-
When demand (aggressive buyers using market orders)
outstrips the standing supply of stock available to buy right now, prices rise (trend up);
and when supply (aggressive sellers using market orders) overpowers the standing demand for stock, prices drop (trend down).
By the way, traders and investors use limit orders to establish standing supply and demand.
At some point, prices will become momentarily too high or too low and the current trend will reverse as new traders come to market to take advantage of the new perceived value imbalance.
I see minor (less likely to hold) overhead resistance at about $7.33 (see the light-orange dotted line);
resistance
is a very narrow price range where an uptrend is halted and reversed because supply–selling power–exceeds demand–buying power
because the majority of active market participants believes prices are trading at a premium.
I also see minor support at about $7.20;
support
is a narrow price range where a downtrend is reversed because current buyers–demand–outnumber the sellers–supply of stock for sale–
because the active majority believes prices are trading at a discount.
Prices seem to be trapped in a near-term (wider) trading range, called a Support and Resistance (S/R) Channel, between the solid green 200-day MA and the rising 20-day MA.
In fact, notice how often prices seem to find minor support or resistance at these Moving Averages (MAs).
This support and resistance channel is the market's current collective view of fair value given all that is known or believed at that moment in time.
It is an abundance of savvy buyers near the bottom of this channel and a surplus of savvy sellers near the top that create this support and resistance channel.
It often takes a change in the fundamental story to cause a break-out (go up) or break-down (go down) from the current minor trading range;
and when this occurs, the current channel will shift up or down to better reflect the news or commentary.
Over much longer periods of time, like over the course of a year or 52-weeks,
we can see much wider, major (more likely to hold) support and resistance channel.
- I see resistance at about $7.80 (see the red dotted line)
and support at about $7.03 (see the dark-green dotted line).
- We see an intermediate-term trend reversal (from bearish to bullish), which occurred on Sept. 2nd.
Notice the wide red candlestick and large volume bar on that day (highlighted by the blue dotted ellipse).
Furthermore we see a divergence
between RSI pivots and price pivots (highlighted by the two light-green dotted ellipses —
prices are putting in a pattern of lower-lows, but RSI is putting in a pattern of higher-lows);
there is also a divergence between prices and MACD, but it's on a longer time frame (refer to the late June low and the September low).
These two are classic technical patterns that results from one or more large fund managers liquidating or reducing the size of a position in an issue.
These guys are able to accumulate and hold huge positions; and because of their size, it take time to get in and out;
and their buying and selling will always perturb near-term prices, if they move with any haste.
I personally suspect that one or more large fund managers where re-adjusting their portfolios to favor growth over value,
capital application (price movement) over income, or equity (stocks) over debt (bonds) —
either way EOD is perceived by market professionals as being a Value, Income play that trades like a bond —
any one of these reasons could cause a modification in a professional manager's asset allocation.
There are two very important things we do not see in this chart, things that will ultimately affect every future chart:
- Whenever this issue (any stock) pays a dividend (goes Ex-Dividend),
every historic data point in the chart (including the current price) will be reduced by the amount of that dividend
(the last dividend was 21¢ per share, so the whole chart was adjusted down 21¢).
Why? Because the value of the dividend per share that was on the books of the investment (the RIC) have been transferred to the owners of that investment —
that value is no longer in the investment, it's in your pocket; and the shift down in price shows that loss of value.
However, prices should go back up as new value is generated (earned) by that business (the RIC).
- Charts are backwards looking, they are very good at showing where buyers and seller created Support or Resistance in the past; but there's no guarantee about the future.
However, assuming there is no real change in the longer-term fundamental story, it's a good bet they'll show up again at the prior levels, pivot points on the current chart.
You can used these levels to target your limit orders, just don't be too greedy — select prices that are likely to be hit if prices trade in that range.
Let's take a look at the weekly chart.
I always look at the weekly chart to better understand the broader market trend;
and to better see what the really big fund managers are doing.
Ultimately, we want to trade with (like) them;
and it's their trading bias (bullish or bearish) and their buying at discount prices and selling at premium prices that defines the market's character —
both the current trend and trading range.
Note that these large institutional money managers are some of the best investors in the world;
and they are able to hire some of the best analyst on Wall Street.
It's not too hard to see what they're doing on the weekly chart.
I see the following:
- EOD is currently trading in a sideways trending pennant pattern,
which is defined by the red horizontal major resistance line (level) at $7.80 and the black dotted uptrend line.
If this pattern holds true to expectation, which is no guarantee,
prices should become squeezed (building up pressure) as the two lines (red and black) converge,
eventually resulting in a big move up or down.
This is what all the professional traders are taught; but don't count on it happening.
Eventually we'll need a change in the fundamental story to fulfill this technical pattern.
If fact, all technical patterns show the struggle of wills and trading power
between the bulls and the bears over what is likely to happen next.
In the short-run, the stronger group will drive the price action;
but over the long-run, the actual fundamental reports will correct any short-term technical mispricing.
Ultimately we'll need to see a real improvement in global GDP to see a sustainable upside break-out;
and I believe we're starting to see that improvement now.
But if we do not see that growth (i.e., no change),
I believe we'll see a failed break-out followed by a break-down to test one or more of the support levels below the pennant (addressed next),
and thus creating a sideways continuation pattern until we see a real change in global GDP,
and as dividend are paid out, this new support and resistance channel will move down by 21¢ or whatever the dividend size is,
and we'll have to work our position accordingly.
And if we see deterioration in global growth,
we'll see a new down trend in this issue;
and if that happens,
we should seriously consider an exit or a big reduction in the size of any position in this stock to minimize capital loss —
we can always get back in with a new, lower cost-basis after we see new signs of economic improvement.
- I see the following (light green dotted lines) minor support levels at about $7.03ish and $6.53ish; and both price points would be good levels to buy a little more.
- I also see major support at about $6.07 (the dark green dotted line); and this would be a great level to buy a whole lot more.
When I have the buying power, I like to leave an open limit order to buy just above these major support levels
because every once in a great while we'll get a market scare that will cause one or more of these big fund managers to dump some or all of their position,
which will result in my low-ball order being filled, and once the dust settles prices will often return to the prior trading range or at least to some higher trading range.
The Planning
When it comes to investing in anything, including CEFs,
we need to focus on the Total Return,
which includes the capital appreciation (change in price) plus the sum of all income distributions;
and to that end,
I have two competing thoughts that have to be managed.
1) I have to be in it (the investment) to realize the benefits;
and 2) The less I have to pay (the lower my cost-basis),
the better my odds are of getting out with a nice total return.
I find that it helps a lot to have a process and a set of tools to record the planning details and to track the results for later analysis.
Let me also say that the following may sound like a lot of work to some;
but I find that forcing myself to work through this check-list and to write down my thoughts
does in fact yield better equity growth in my brokerage account.
I use Microsoft Word and Excel to plan and track my investments (trades).
I use a Word document, one per day, as my Trading Journal.
A Word document is a good place to store high-level planning information, and detailed pictures (screen snapshots of charts, etc.)
and my notes about these pictures.
At the end of each trading day, after the close, I update my journal page with a fresh set of charts and notes.
The journal page starts with the economy,
then addresses the broader market indices and related market breadth,
and then each issue in my watch list.
My watch list identifies all the issues I either have a position in or would be willing to take a position in,
if the market were to offer a proper discount.
The next morning, before the open,
I use yesterday's journal page to create a new page for today
(BTW: the file names is the date).
I review the morning's news and commentary, and yesterday's journal data;
and then make whatever plan adjustments that are appropriate.
I use an Excel spreadsheet, one for each brokerage account per year, to plan out the financial projections and to track the after the fact (trade) accounting results.
Let me take this opportunity to say a little something about selecting our target buy and sell prices.
As a general rule we want to buy support and sell resistance — we want to carve out as much of the fair value price range as we can reasonably get;
but so does everyone else — that's what creates the support and resistance we're trying to play.
So if we want to get our orders filled,
we need to pick target prices that are a little in front of that crowd.
By the way, it is just this type of trading tactic that causes support and resistance channels to narrow over time.
Let's build a spreadsheet that will help us to better understand the P&L (Profit and Loss) profile given all the information above.
I'll use a limit order to hopefully buy a pull back into the $7.07 range (refer to the charts above);
and if I get that fill, I'll use a limit order at $7.74 to sell some or all of that position into any rally towards resistance at the $7.8 level.
Note that when EOD goes Ex-Div, these prices will shift down 21¢ (the current dividend per share).
Most brokers will automatically shift down any open buy limit orders by the amount of the dividend on the Ex-Div date;
but they will not alter the sell limit orders, so you many need to lower your as the S/R Channel has shifted down by the size of the dividend.
In the spreadsheet figure below we see the P&L for a 200 share buy at $7.07 and sell at $7.74.
Note that my broker (Merrill Edge) does not charge me a commission for my 1st 100 trades per month (Buy & Sell Cost in the spreadsheet),
so I've not shown those costs here;
but you'll need to factor in your real trading costs.
Cell F27 shows the cash going into the position,
cell J27 ("Total Return") shows the projected cash coming back out,
and cells K27 & L27 shows the projected capital gain and yield — a measure of Total Return.
So this trade, if successful, would generate a $133.97 capital gain, a yield of 9.5% for the holding period,
plus any dividends paid out
(at current prices, EOD should pay something like a 10% yield)
while I wait for that capital gain.
If it takes a year to run this trade,
I could realize something like a very nice 20% Total Return —
now that's sweet!
Once in the position, when prices are trading towards my target price of $7.74,
if I continue to feel that global GDP is improving,
I'm likely to sell half the position and hold half for any break-out above this major resistance level at $7.80,
which I could then hold for a much bigger move up (go after the big economic up trend);
and I'll use the cash from the sale to buy back in at lower prices (if major resistance holds)
or to buy the next pull-back on the way up (if major resistance is broken and then
converted
to major support).
And if things still look weak and uncertain,
I'll just dump the whole position (take that nice 20% total return);
and then look to do it all again
with this or some other issue.

So that's the simple plan (the paragraph above);
but what if things don't go according to that plan.
Let's assume, however, that we did get the first fill at $7.07 and
we have a position in EOD
and we are now waiting for the second fill at $7.74.
But instead of prices going up as expected,
let's assume prices drop further,
a break-down through that black diagonal uptrend line on the weekly chart above.
I would setup a limit order to buy more at $6.57.
In fact, I would probably setup that buy limit order at the same time I setup the sell limit order at $7.74.
Below is a figure I've pulled from the spreadsheet,
which shows the P&L for this progression.
Lines 31 and 32 show the original position.
Columns A through E on line 31 shows the investment details
(for now, let's ignore D31, the percent of Net Worth of the portfolio or brokerage account;
this information is useful when we're planning out a broader asset allocation).
Columns F through H show my profit target.
The next line down (cells F32 to H32) automatically shows the price and P&L for a 10% capital-gain
(using cell E31, the break-even price of the position).
Columns I through L show the P&L based on the last price (cell I31 is Friday's 4 pm closing price).
The line just below that (cells I32 & L32) is used to track the impact of dividends paid out (currently none in cell J32);
and the next two cells (K32 & L32) shows the current Total Return with dividends of the position — the definitive P&L value!
The line below that (cells I33 to L33) show the projected annual dividend income from the original 200 share position (cell B31).
Lines 34 & 35 should the P&L impact of buying another 200 shares at $6.57;
and lines 37 & 38 shows the impact of yet another 200 shares bought at $6.07.
You can, of course, use a spreadsheet like this to play What If games with the data to better understand the alternatives,
and to track and plan out the alternative options as time progresses.
Below is an alternative planning approach that is based purely on volatility
(the security's Beta,
which is different than the Beta above — Wall Street can be so confusing),
which I was able to find on Morningstar —
I used the Best-Fit value of 0.55 (input cell F43).
Here's the basic idea.
We're going to divide our investment capital into 5 parts.
If I use the 1st part to buy at $7.07 (input cell B44) and set the target sell price at $7.74 (input cell K43).
All the other cells show how the trade could progress.
In column H we see the Average price per share, which is the position's cost-basis being pulled down with each subsequent buy.
We also see in column L how the Capital Gain could increase, if we kept the initial sell Target Price.
Scaling into (Averaging Down) a Position —
Here's the basic idea.
1) We're working with a security that is very likely to survive — only use this averaging down strategy on mutual funds, like CTFs and ETFs or on mature stable blue-chip issues.
2) We want each subsequent buy (addition to the position) to really pull down the cost-basis (average or break-even price) on the position.
Ideally, we want to keep the position's cost-basis within the current trading range,
so that any upswing in price is an opportunity to realize a profit or at least a break-even on those positions that have yielded our targeted total return via dividends only.
The key is to make each buy interval larger than the prior interval or each buy size larger than the prior (or both),
so that each addition to the position works that much more effectively to pull down our cost-basis.
Below we have another set of numbers that have been modified to use an increasing size parameter;
and I also started with a little higher initial buy price of $7.25 (the current price) just to give you a better feel for how effective an increase in size can be.
The figures above were pulled from this spreadsheet on the Investments page (see the tabs on the bottom left).
This spreadsheet is a stripped down version of the one I was using at the time, I left in the details for the EOD position.
This position was closed on Feb. 28th, 2014 using a $7.74 limit order
for a total return of $1,636.50 on a cost-basis of $19,188.97 with a holding period yield of 9.37%,
but because I held this for position for 530 days the annualized yield was only 6.4%.
I decided to close the whole position because I thought the market and this issue had become a bit overbought and
because I had found a better place to invest this capital into using the very same strategy.
Here's a daily chart taken after the close.
Note the topping tail, RSI, the spread of prices and the MAs,
and how much the prices have shifted down due to dividends paid through the holding period.
In Closing
A proper Asset Allocation
is a great way to reduce risk and improve total return in any portfolio;
and much of this topic is beyond the scope of this paper.
But I think it is sensible to at least say that as a general rule
I do this type of planning (introduced above)
for a number of uncorrelated (or at least loosely correlated) funds,
like:
BGY,
CII,
CHI,
EOS,
EXG,
GAB,
GGN,
GUT,
JCE,
NFJ,
PGP,
PHK,
PKO,
PMF,
PTY,
RCS,
RFI, and
TEI.
Basically, I'll put out my limit orders for each fund to buy at an appropriate discount (support) level,
like discussed above.
I then let the market tell me which positions have to be worked,
which will be a function of which orders get filled first,
and which, of course, is a function of where the market goes.
Simply put,
I try to keep my operations in-synch with the economic health of broader market trend,
focus most of my time and capital on a few naturally diversified issues that can survive the vagaries of the market and that will pay me to hold,
buy value when it's presented to me,
sell at premium prices when offered or when the market says it's time to get out,
and to earn income while I wait for my capital gain.
This is the best way I know to grow the size of my brokerage account.
Here's a link to Closed-End Fund Advisors.
They provide both free and fee based information and services.
Here are two old but still very good books on the subject:
Morningstar's Solutions
web page is a timely place to find current information,
which is mostly very good and well worth reading;
but I have to confess that I don't agree with everything I've read there,
thanks to what I've learned from the two books above, numerous other sources, and my own experiences over the previous two decades.
Please understand that the authors above made their (very good) livings trading and investing in closed-end funds.
Ask yourself, who should know best?
The guys who do this for a living or
the guys who makes their living selling information to others who want to make money in the market.
Still, it's always good to know what others are saying about the investments you are looking at.
I hope you found the above information useful;
and please feel free to questions and challenge any of this stuff.
Stan Benson
Sept. 29, 2013