My Trading Plan
The formula for Success in my Trading Business:
Relevant Market Wisdom + Preparation and Planning + Patient and Persistent Execution of the Plan + Results Analysis
In this paper, I'll tend to use the words trade and trading,
but you should understand that I'm also thinking invest and investing.
As far as I'm concerned,
they are virtually interchangeable —
note that all investments begin and end with a trade.
The only possible difference may be in terms of timeframe.
All investments are just longer-term trades,
which requires a little more focus on the underlying fundamentals
supporting expected future value.
A professional trader is driven by a clear set of rules.
These rules allow the professional to control the Trading Idiot — our undisciplined, reactive, alter ego.
Whenever we allow our actions to be guided by our primitive emotional (gut-feel) responses to real-time market developments,
instead of a well-considered trading plan,
we're very likely to lose our capital to those who do have the self-discipline to develop and follow a trading plan
that is based on a rational set of time tested rules.
In books and in seminars, professionals preach the "Golden Rules" that make up many of the basics of successful trading.
But human nature being what it is, we proceed without proper planning and trading rules, and instead rely on our gut-feeling;
and as a result, we start to lose our trading capital.
We stubbornly continue until the pain is so great that we either quit or reach down deep inside of ourselves to find the "real" answers,
the rules we need to survive and grow our equity.
After a lot of hard work, more pain, and what generally seems like a very long time,
the trader begins to realize success that is based on the self-discipline needed to follow their own set of rules.
Ironically, these rules always seem to turn out to be some variation on the "Golden Rules"
that were probably taught in the aforementioned books and seminars.
The trader just had to discover their true meaning for themselves, like a child with a hot stove,
he or she had to learn why these rule must be rigorously followed.
The following is my set of Golden Rules:
- Maintain relevant market wisdom,
This is all about understanding the Market's Nature and
about keeping abreast of current events —
news and commentary, and the associated technical price action both before and after this information hits the tape.
It's not really about being quick, although that helps,
it's about knowing the rules of the game, the tools of the trade, the players, the plays (trading strategies),
and most of all, doing your daily homework — the pre-trade scanning (looking for favorable setups), multi-time frame chart analysis
(understanding the odds and risk-to-reward ratios of each setup),
and trade planning (knowing before the trade where to enter, add or reduce size, and knowing where and/or when to exit).
- Keep my operations in-synch with the health of the broader market trend,
If there were just one rule, this would be it —
When the broader trend is up, look for favorable long setups,
and when that trend is down, look for favorable short setups or just go to cash to preserve capital;
and when the trend is unclear, I must stay in cash until the trend becomes clear.
And when the broader trend turns against my open position, I close that position!
Generally speaking,
the broader market trend is the technical price action of the major market indices (e.g., S&P 500) and
the relative price action of the last 200 bars of the individual issue(s) to be traded,
with a little extra focus on the last 8 & 20 bars.
From a longer-term investment perspective,
the broader market trend is the current phase of the economic cycle.
Note that bigger players have to play in longer time frames
(because of their size, it simply takes time to adjust their position without dramatically impacting prices to their detriment); and
that's why trends in longer time frames tend to overpower counter trends and bases in shorter time frames.
In this business, size matters, and the odds favor trading with the dominate group.
Technically speaking,
I'll use the slope of the 20 period simple Moving Average (MA) on my trading time frame
and on the next one or two longer time frames to set my trading bias —
Bullish or Bearish.
I'll also take into consideration the 50- and 200-MAs too.
I'll also focus in on the pattern of pivots —
In stable up trends,
I'll need to see a pattern of 3- to 5-bar trusts up to higher pivot highs followed by minor retracements to higher pivot lows;
and in stable down trends,
I'll need to see a pattern of similar trusts into lower pivot lows with small retracements to lower pivot highs.
Oliver likes to say,
"If it ain't got that swing, don't do a thing!"
It's just market noise that'll chop-up your trading account in little, worth-less pieces.
I also like to see a little more volume on the trusts and a little less on the retracements.
Refer to Trip Screen Trading in Trading for a Living.
- Manage my average price per share for each open position,
Managing a position's cost basis (the average price per share),
while observing the prior rule,
is the best single way to significantly improve trade results.
Recognizing that prices naturally trade up and down all the time;
and they can always go higher or lower after a trade is made.
Professionals break their position capital down into parts to be better able to take advantage of any future price movement;
thus giving them options as to how they'll earn their targeted rate of return or whatever the market has to offer.
We can do the same thing.
Thus allows us to take advantage of natural volatility over time —
to buy support (at discount prices relative to the current trading range) and sell resistance (at relative premium prices),
which are levels (pivots) found on the current chart and on longer timeframes.
Note that support is often found at prior pivot lows and resistance at pivot highs,
and both can often be found near the popular 20, 50 and 200 period moving averages.
Let's say the broader market trend is up,
and you wait for a low-risk setup and get in at a reasonably available discount
(e.g., buying a bounce off near-term support).
If that security goes as planned and you reach your profit target (based on the trading range and position size allows),
you're free to take your profit (or at least book some of that profit).
But what if that trade goes against us?
We can use some of our buying power to manage our cost basis.
Continuing the example above where you bought a bounce off support,
but this time, prices breakdown through near-term support,
putting in a lower pivot low (a bounce off a lower, longer-term support level).
Instead of executing your stop-loss, when the initial support level was broken (like you should on any non-survivable issues),
you're free to add to that survivable position at some lower support level,
which lowers our cost basis (break-even price)
and makes it easier to reach our current or revised capital gain target on the next or a future price upswing.
The goal here is to keep your cost basis (the average price per share) as close to the market's current price range as possible,
thus allowing any significant upswing to be a profit taking opportunity,
which means you need each successive commitment of capital to be that much larger
(either a larger drop in price and/or a larger capital allocation)
thus pulling down that average price per share to within the current trading range.
- Maintain a reasonably diversified asset allocation,
These are the major asset classes: Stable-dollar funds, Stocks, Bonds, Real Estate, Commodities, Currencies & Collectibles;
and I try to keep 90% of my capital in the first four.
Reasonable diversification is all about having the money within an asset class invested or placed in issues that can
survive the market's up and down cycles; and
another form of diversification is by management style
(e.g., actively managed versus passively managed indices).
I prefer to own just a few issues that meet the criteria above and that will pay me to hold
(e.g., VMMXX,
VBINX,
VWINX, &
VGSIX),
thus giving me a real option to average down my cost-basis,
instead of being force to give my capital to the market via stop-loss.
- Plan my trades and investments,
Start by simply writing down what you think you need to do; and then revise that plan as you learn more about what works and what does not work.
It's best to do your planning while the market is closed and you're not subject to real-time stimulus.
Don't just think about it, write it down as the process of writing tends to bring forth rationality and clarity —
it's the difference between the second it takes to come up with a bright idea and the hour(s) it takes to commit a lucid thought to paper.
(Don't be the Trading Idiot that brings a bright idea and a rusty knife to a professional gun fight.)
This plan needs to describe the technical details of each strategy I'm looking to play
and include a set of rules to control all of my operations — every buy and sell transaction.
This is all about my pre-trade perpetrations.
Pre-trade preparations includes a proper analysis of the broader market averages, those issues in the news (the Gappers), and
a proper daily scan of my favorite issues.
As a result of this analysis, I'll create/update my intraday watch list —
a list of securities that look like they are very likely to offer a favorable strategy setup.
Basically, this plan lays out how I'll run my trading business every day.
- Trade my plan, and
This is all about having the self-discipline to patiently and persistently execute my trading plan.
I need to:
1) Monitor, both manually and via software, my watch list.
2) Wait for a favorable setup in the direction of the broader market trend; given a setup,
3) I need to analyze the risk-to-reward (support and resistance levels) on all relevant time frames and I need to consider relative strength and reversal timings;
assuming a favorable setup,
4) I need to enter and manage the trade as planned — A well executed plan is the Professional Trader's edge.
- Document and Analyze the Results.
This is a critical part of this business.
Not only for tax and accounting reasons (which is required by law),
I need this for developmental reason.
Growth is an iterative process entailing objectives, analysis, planning, execution, and a review of the results.
This process will help me to find and eliminate things that negatively impact my trading business and
it also helps me to understand what is beneficial and should be continued and/or enhanced.
Once a week, I'll execute the following steps:
- Review the Economic Data to understand where we are in the current economy's boom-and-bust
Business Cycle
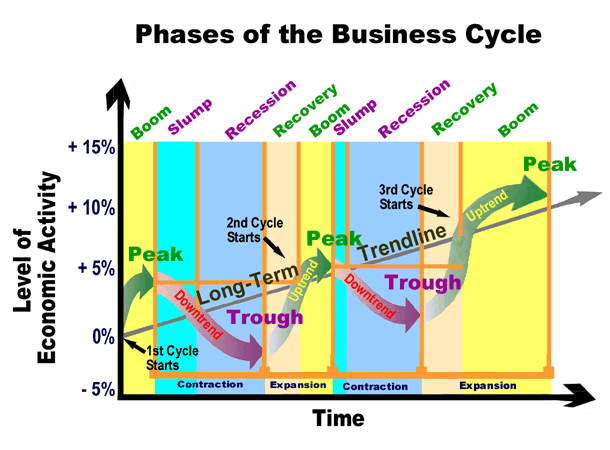 .
It is critical to maintain an asset allocation that is in-synch with the health of the current economic trend.
The current boom-and-bust (recovery-and-recession) cyclical phase of the Business Cycle is the most fundament factor affecting every investment.
Riskier securities (investments) like equities (stocks) and corporate debt (bonds) always do better when the economy is in recovery (booming)
and defensive issues (securities) like government bonds always do better when the economy is in recession (busted).
The best source of free simplified (boom-bust) economic data is from the ECRI's Public Indexes web page,
and a good source of free consolidated information is from www.TradingEconomics.com.
Unfortunately, the economic data is always backward looking and subject to revision;
but fortunately, the economic trend is very slow moving
and very likely to continue for many months and even years
until the news in the popular media cannot be justified by any rational economic reality
(e.g., a bull-market uptrend will end after growth rates have risen to an unsustainable high,
interest rates have risen to levels that make top-quality bonds a better risk-adjusted alternative to equities,
and great news fails to usher in yet another new market high;
and a bear-market downtrend will end after equities have been priced for Armageddon,
interest rates are effectively zero and underperforming top-quality equity dividends,
and more miserable news fails to deliver yet another new market low).
There are the two very important things that need to be understood about investing with the health of the current economic trend.
First, the (red) stock market cyclical trend always leads (anticipates) the (green) economic trend (as seen in the figure Sector Rotation Model)
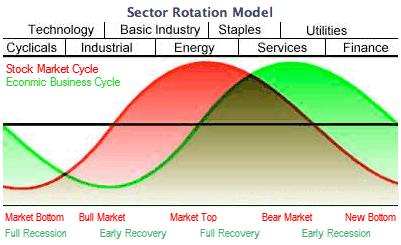 ;
and second, you don't have to catch (time) the actual turn in the economic,
just keep your investment allocation in-synch with the broader economic trend
(here's the tell —
if your investment keeps losing money (no matter what you do),
your investment is simply not in-synch with the broader market trend —
get out and find a better place to invest your money).
Right now, we're in weak economic recovery mode.
Interest rates have only increased a little bit in anticipation that the Fed will do that next —
in fact the Fed has yet to start or even talk about starting.
Bottom line: This should be a good time to invest in risker issues, like stocks and corporate bonds.
- For each Issue in my Watch List review monthly and weekly charts, analytical reports, news and commentary, and my trading and investing strategy.
This is also a good time to check my asset allocation and to verify that my watch list is (my time is being) focused on issues that are likely to do well in the current economic environment.
This is a good time to check my overall trading bias (bullish or bearish) and to set my general price targets, both entry and exit price ranges.
This is all about having a good handle on the big picture.
On every trading day, I'll execute the following Trading Plan:
My Pre-Market Routine
These are the tasks I perform before the market opens for trading;
and if I get a late start, I'm not allowed to trade until tasks 1 through 5 & 8 below are performed:
- Update my financial records based on any overnight changes to ensure a clear picture of my financial position.
- Review and Monitor News and Commentary, which can drive price changes.
News and commentary can often stimulate a supply/demand imbalance,
thus creating new price trends or extent the current trend to pivot reversal extremes.
I'll turn on CNBC when I wake up, and log on to one of the VCM Chat Rooms,
as these source of information give me trading ideas, educational information, and an opportunity to network with peers.
We need to be aware of the scheduled release of economic news and company reports,
as prices will often move in anticipation of these releases and correct or fade away after the release.
It is very important to see how prices react to the news and commentary
as this is the key to understanding the "Message of the Market" or the "Tail of the Tape"
(Wall Street speak for what's happening now and therefore likely to happen next, thanks to relevant market wisdom —
prices that fail to go down on bad news or fail to go up on good news are issues that are ready for a primary trend reversal).
- Analyze the Broader Market Trends and Developing Chart Patterns of the Major Market Indices
(i.e., Wilshire-5000, DJIA, DJTA, DJUA, Nasdaq-100, S&P-500, & Russell-2000).
This is a top-down analysis approach
and is well worth doing because stocks that are not being driven by specific news will trade with their associated index.
Note: How I analyze a chart Like most other professional traders,
I'll use 20-, 50- & 200-period simple moving averages on all my charts;
and on just the weekly I'll use a 10- & 40-period MA as these are the same as the 50 & 200 on the daily chart
(many big institutional portfolio managers use these moving averages and it pays to know what these elephants are watching
because when they decide to make an adjustment to their portfolio, prices will be impacted).
First, I consider the slope of the 20 period simple moving average, which I'll use to set my trading bias (long or short).
Second, I'll consider the relationship between moving averages. I like to see the smaller (quicker) MAs leading the bigger (slower) up or down,
which is a nice sign of a power trend.
Then I consider the distance from the last few prints (trades) from the 20 MA,
because when prices get too far away, they tend to pull back to that MA.
And then I consider the pivot patterns;
I'm looking for a clear pattern of higher pivot lows (an up trend) or lower pivot highs (a down trend).
Finally, I'll note the location of likely support and resistance levels (prior pivots) that are likely to come into play.
Most of the time I expect to see C.R.A.P. (Can't Recognize A Pattern) because the market spends much of it's time in lower-odds, pseudo random slop.
But every now and then, I'll see a higher-odds pattern (one that realy puts the odds in my favor) and these are what I'm looking for.
- Analyze Relative Strength Leaders and Laggers,
which sectors are trending up and which are trending down,
and which issues in each are leading and lagging.
I prefer to use the SPDR Select Stock Sector Funds
(XLB,
XLE,
XLF,
XLK,
XLP,
XLU,
XLV,
XLY),
the following closed-end focused funds which are competitors to stocks
(BND,
IYR, &
UUP), and the following funds which tend to move counter to the U.S. Dollar
(DBC,
USO,
GLD).
We need to understand which trends are likely to continue and which are ready to reverse.
We'll favor leaders in trends that are likely to continue and watch laggers in trends that may be ready to reverse
as these issues tend to become the new leaders.
Of course, the best time to trade a trend is near the beginning of the move, and
not when it's obvious to everyone, as that's when it's most likely to be approaching a reversal extreme.
This approach helps me to find both bullish and bearish stocks to watch for trading opportunities.
- Analyze current Open Positions.
Review the Price and Volume action relative to the 8-, 20-, & 200-period simple moving averages on daily, 60-, & 15-minture charts;
and on the daily, I'll also use the 50 MA, and on the weekly, I'll use the 10- & 40-period.
I will also consider RSI, MACD, and On-Balance Volume —
I'm looking for divergences between these indicators and the actual price action
(e.g., if prices are making higher highs, but the indicator is not, start looking for a trend reversal).
I need to verify that my open positions are in-synch with the broader market trend —
I need to see higher volume on thrusts (moves in the direction of the trend) and lower volume in the retracements; and
I need to see a pattern of higher pivot lows and higher pivot highs in up trends and
lower pivot highs and lower pivot lows in down trends.
When possible, I'll also consider the price/volume action relative to recent news and commentary —
I'm looking to see if any of these issues fail to move up on bullish news or fail to move down on bearish news.
Any position that fails to meet these criteria (based on total risk exposure) needs to be closed, scaled back or at a minimum have its stop tightened up.
- Analyze Gappers — issues that are likely to open above or below the prior day's close on higher than average volume.
We're looking for issues that are likely to make considerable moves up or down and tend to be "stocks in the news" (more on this later).
- Scan, Analyze and Update my List of Trading Candidates (a.k.a., My Universe List),
this is my big list of issues that I have traded or may want to trade given a favorable setup.
This process is very time consuming and may be done at any time as time permits.
I'm looking to trade stable (up, down or sideways) trends; and I'm looking to avoid wide, sloppy, choppy bases.
Any issue that looks like it might be setting up a favorable trading opportunity is a candidate to be added to my Watch List.
Note that the size of my Watch List needs to be restricted to a manageable size.
I find that I'm able to effectively process about 10 to 25 stocks.
The smaller the size, the easier it is to do a good job, at the expense of getting (seeing) fewer favorable setups.
- Review/Update my Watch List, which I use during the trading day to find favorable (low-risk, high-reward) trading setups.
This list actually has two parts and can be quickly separated in two lists.
One is my Bullish Watch List and the other is my Bearish Watch List.
When the broader market trend is up, I focus most of my attention on bullish issues;
and when the market trend is down, the bearish part of the list is the money maker.
I'll build/update this list based on the analysis approach addressed above and
on real-time information that develops as the trading day progresses.
For each issue on my watch list
I'll mark on my Daily, 60- & 15-minute charts support and resistance levels that are likely to come into play,
as these will be my buy and sell points that I'll use to quickly establish my entry and exit targets (i.e., risk/reward ratios).
I'll also consider the developing price pattern to set/validate my trading bias (long or short),
with particular attention to progressing pivots (are they making higher high or lower lows) and the 20-period moving averages on these charts.
The goal here is to prepare a trading plan (a marked-up set of charts) for each of these issues.
A plan that allows me to quickly establish the favorability (risk-to-reward) of each trading opportunity while the market is open and
data is flowing in real-time
(i.e., it allows me to effectively trade the "Hard Right Edge" of the chart).
When appropriate, I'll program alarms to warn me that a price target has been reached or a favorable pattern is developing.
My Intraday Watch List Scanning Routine
While the market is open for trading (9:30 AM to 4:00 PM Eastern Time)
I'll scan my watch list to find low-risk, high-reward trading opportunities —
Buy Support and Sell Resistance in the direction of the Broader Market Trend.
For each setup,
I'll need to establish a target entry price, initial stop-loss price,
the size of my initial position,
an initial profit target, where I'll generally dump a third or half of the position,
to lock in some profit,
and a secondary profit target for the second third or another half (1/4 of the initial position),
but as a general rule, we'll allow a trailing stop to take us out, thus allowing some of our profits to run.
I'll also need to establish
any conditions (including size and price) that would allow me to add to the position, and
any conditions (including size and price) that would require me to reduce the size of the position.
During the trading day, I'll loop through my list of stocks to watch.
Use the following rules to analyze the daily, hourly, 15- & 5-minute charts for each symbol.
I'm looking for a favorable (low-risk, high-reward) trading opportunities;
and as soon as I realize that I'm not looking at a favorable opportunity,
I'll advance to the next symbol in the watch list and restart the follow list again.
When a charting pattern is able to make it through the following list,
I have a possible trading opportunity.
Now I wait for proper setup to enter;
and once in,
I set my initial stop loss and profit target limit order.
I then periodically check the progress and tighten your trailing stop.
- Set my trading bias (long or short) based on the color of the daily bar after 10:30,
and I'll always use the slope of the 20 MA on the 60- & 15- minute charts.
- Is this trend in-synch with the broader market or is it on its own?
- Does this symbol have relative strength or weakness? I prefer to trade leaders, not laggards.
However, current laggards often become leaders when the trend reverses.
- Identify Support & Resistance levels on the daily, 60- & 15-minute charts.
- Consider possible Entry, Stop, & Profit targets.
Based on these points, do we have a favorable (low-risk, high-reward) trading opportunity?
If yes, set an alarm to signal the entry price has been reached.
When the alarm fires,
do a quick chart analysis to ensure that we still have a favorable trading opportunity.
If still good, enter and then set your stop and target (range) order.
Periodically check the progress and tighten your trailing stop.
My Global Trading Rules
My Trading Routine
- No impulsive trading!
Preparation, Patience, and Disciple are the keys to success.
Understand that your trading edge lies in your ability to apply one or more trading (investing) strategy
that has a positive expectancy — puts the odds in your favor,
your ability to wait for the market to offer up a quality setup for that strategy,
your ability to follow your planned strategy, and
your ability to refine and grow your trading plan as you learn more about what works and what does not work in various market environments.
- Keep my operations in-synch with the health of the broader market trend.
If the trend is unclear, stand aside until it becomes clear!
Trade only in the direction of the trend; and
if the trend turns against my position, either close or reverse that position based on the favorability of the current situation.
When a healthy (i.e., sustainable) trend develops on a longer-term time frame (e.g., daily or 60-minute chart),
I'll look to trade in the direction of that trend on a shorter-term time frame (e.g., 15- or 5-minute chart).
Avoid buying in
RSI
Overbought and selling Oversold conditions.
Note that the odds greatly favor trades that have setups and/or biases in the same direction on multiple time frames.
Before taking any trade, analyze the broader market environment.
There's no substitute for proper market awareness — understand the daily news and commentary,
and the associated price action on multi-time frame charts.
Understand the "Message of the Market." or the "Tail of the Tape."
This information is fundamental to proper trade planning!
On rare occasions (less than 10% of the time), when the setup is just right (has a vary favorable risk to reward ratio),
I allow myself to take a counter trend trade (against the broader market trend);
but I'm not allowed to scale in, I can pyramid in if it looks like I've been able to catch a primary trend reversal.
I must use a very tight initial stop,
because most counter trend trades have no follow-through and are at best a good scalp.
- Patiently wait for a setup of one of my Trading Strategies
Be patient.
Wait for the market to come to you with a quality setup.
Given a favorable setup, check the Risk-to-Reward ratio,
which is likely to be defined by the Prior Day's Closing price,
support and resistance levels, and the popular 20 & 200 period simple moving averages on all relevant time frames.
A favorable trading opportunity has a 1 to 2 or better risk-to-reward ratio
(lower ratios are acceptable when the odds are very favorable).
My risk is the difference between my entry price and my stop-loss price —
the amount I'm willing to lose, if this trade goes against me.
My reward for taking this risk is the difference between my entry price and my initial profit target price.
I define low-risk by my ability to cut my losses short.
I define high-reward by my ability to allow my winners to run to the target,
and in clearly trending market, I'll use trailing stops to allow the market to reward me with all it has to offer.
By only taking favorable trades, and
using appropriate Initial and Trailing Stops,
I am able to earn a high Win/Loss Ratio and Batting Average,
which is the hallmark of a professional trader.
Consider Relative Strength and Reversal Timing.
When the broader market trend is up, we want to buy issues that are leading the index up; and
when that trend is down, we want to short the issues that are leading the index down.
Be sure your new trade is sensitive to intraday reversal times (9:35, 10:00, 10:30, 11:15, 12:00, 1:30, 2:15, 3:00 & 3:30).
If the setup still looks good, Share size the entry and enter the position.
If I get stopped (whipped) out of an otherwise good trade (i.e., the setup still looks favorable)
I allow myself to take a second try (another entry).
As a general rule, I'll trade the 5-minute chart as my primary time frame.
That's the chart I'll use to look for my buy and sell setups.
I'll look to the daily, 60- and 15-minute charts for my trading bias —
basically, I'm looking for power trends in the longer-term charts that are likely to drive the price action in the shorter-term charts.
As always, I'm looking to trade stable (up, down or sideways) trends; and I'm looking to avoid sloppy, choppy bases.
Beware of trends that run for three days on the hourly chart as this is the same as a three bar move on the daily
and are thus ready for a pivot reversal.
This does not mean that a reversal will happen;
it just means that we're starting to get a bit over done.
I'm not allowed to scale into a position while in a choppy basing market.
In these markets, the trade either goes my way or it gets killed — I'll let my winners run and cut my losers short!
Only take trades that have tight spreads (e.g., less than 3 cents).
Only trade stocks with great liquidity (i.e., average daily volume in excess of 10 million shares).
Favor stocks that trade above $5 and below $50.
I can do others when I have a perfect setup;
most of my success has been with this price range and that's why I should stay focused on that price range.
Don't chase momentum!
That's a retail sucker move.
For example, buying a wide range bar after a seeing a few normal range bars that are all moving up;
that last wide range bar normally marks the end of the move as everyone who was scared of missing the move put in their market orders to buy.
It's best to way for a pull back (a proper setup);
and if the issue is in a power trend (won't give you a setup),
drop down to the next lower time frame and look for a setup there.
- Manage the losses!
Wait for a quality setup — with a favorable Risk-to-Reward Ratio.
which allows you to either use a very tight stop
(use whenever the trade is either going to blast-off into profitability or stop-out for a small loss)
or a very wide stop that is not very likely to be hit
(used whenever the trend is strong and not too extend on any relevant time frame).
The latter stop is better; but the market is not always in a power trend,
and that is when I'll favor setups with tight stops.
Never willingly allow the market to take more than 1R —
One Risk Unit = 1/5 of my daily loss limit.
Once I am down 2Rs, I must stop and review my prior trades, and update my trading journal.
I must understand what, if anything, I am doing wrong.
Once I am down 3Rs, I must stop for a minimum of 20 minutes to review my prior trades.
Clearly something is not right.
I'm not allowed to trade until I understand and document the cause for this drawdown;
and when I do resume, I must resume with smaller size (1/2 of my prior size) until I recover the last 1R lost.
Once I am down 4Rs, I must stop for a minimum of one hour to review my trading plan and update my trading journal.
I'm not allowed to trade until I understand and have documented the cause for this drawdown;
and when I do resume, I can resume with an even smaller size of 1/4 to 1/3 of my normal size until I recover the last Rs,
and once that has been recovered, I can increase my size to 1/2 of my normal position size until that R is recovered.
Once I am down 5Rs, I must stop for the rest of the day to study the market, my tools and techniques, and to work on my trading plan.
I am allowed to paper trade; but no more live trading.
- Maintain good documentation and analyze the results.
I'll use Microsoft Word files (one per day) to create a Trading Journal, where I'll document my thoughts on the market,
paste relevant chart snap-shots with highlighted support and resistance levels, targeted entry and exit points,
and where I'll document my results.
I'll also use a Microsoft Excel spreadsheet to track the accounting details associated with each trade and position in each brokerage account.
My Trading Strategies
These trading strategies are also based on support and resistance levels and market trends.
These strategies can be played on whatever time frame the strategy setup (pattern requirements) presents itself.
Note that intraday tends generally take the first hour to develop;
therefore after 10:30 I should only trade in the direction of the daily bar,
unless we get a 55% retracement
(the one rare exception: if I get a very favorable climatic reversal on the 1-, 5- or 15-min charts,
I can take that as a quick scalp, with a smaller position and a very tight stop).
The first strategy is a gap play, which is generally only available at the open,
and is based on a shocking trend reversal.
The second is a "Trend Continuation" play, which is my personal favorite;
but this requires the market to be in a clear trend up or down across multiple, adjacent time frames.
A trending setup can occur on any time frame and should be played on whatever time frame it present itself on;
these can also be played on the next shorter time frame too.
On an intraday basis, power trends tend to run from 10:00 AM to 11:15ish and again from 2:15 PM to 3:00ish.
The second is a "Trend Consolidation" play (a.k.a., a Sideways Trend, a Base, a Trading Range or Band, and a Support/Resistance Channel,
which can occur from time-to-time on any time frame;
however, these tend to occur intraday between 11:15 and 2:15ish.
The third trade is a "Trend Reversal" play, which tend to occur intraday at 9:35, 10:00, 10:30, 11:15, 12:00, 1:30 2:15, 3:00, & 3:30 (+/- a few minutes).
Except for these two reversal times, these tend to occur less frequently,
as a general rule the trend is most likely to continue after a small retracement or consolidation.
Please note that stocks tend to cycle through periods of high activity (trending up or down) and rest (consolidation - trending sideways)
and that this can appear to happen inconsistently on different time frames —
the stock can be in a base on a longer time frame, thrusting up in the next lower (quicker or shorter) time frame, and
basing, pivoting or even trusting in the other direction in the next lower time frame.
Also note that the trend on the longer time frames tend to over power the price action on the shorter time frames;
but when the primary trend reverses, that reversal appear to start on the shorter time frame, on above average volume on wide, near-vertical pivots.
Bottom line, unless you're seeing near-vertical price movement on above average,
always assume that the trend in the longer time frame will continue;
and it will, in time, drive a similar price trend in the shorter time frames!
The following is a closer look at each play:
Each of the following strategies (except for Gap Trades) can support one of two entry and exit types.
The first is called "Plan A" and the other is called "Plan B".
A Plan A entry does not require a Plan A exit.
I'm free to mix and match these based on the individual setup and the plan for that trade.
In fact a common trade may enjoy a Plan B entry, a Plan A Stop, and a Plan B range of profit targets.
Plan A — All-In or All-Out
The primary goal of this entry/exit is to enter my whole position - go All-In and All-Out!
This plan is used when we get an ideal entry situation
(e.g., an entry that has a very attractive risk-to-reward ratio,
i.e., the trade either works straight away or has to be killed).
The Plan A exit is the only exit I use to abort a failed trade (i.e., a hard or soft stop-loss exit).
Plan B — Scale In and Out
This approach works best when the entry/exit is not a clear price, but is a range of prices.
There are times when the stock is in a strong pattern and does not seem to want to provide a nice entry,
this approach allows me to take a small position, which allows me to realize some gain should the pattern continue,
and thus still leaves some buying power should the desired retrace finally present itself.
This approach also works well when a profitable pattern has made a nice run; but could go further.
See Scale In and Out of Your Positions and to Pyramid Into Your Positions.
- Gap Trades
Understand this paper on Gap Plays before taking a gap trade.
Here are the general rules governing my GAP trades:
- Between 9:00 and 9:25 (before the open),
I'll use TradeStation's "Hot List" screen to review issues that are Gapping Up and Down.
- Focus on gaps that are more than 30 cents (above or below the prior closing price) in stocks trading between about $10 and $60.
- Only consider those issues with good pre-market volume.
- Favor stocks I know.
- On the daily chart, color in the missing bar (the gap) and then analyze the developing chart pattern.
- Set your trading bias (bullish or bearish) based on the trending pattern seen on the daily chart before the open.
Does the gap cause a change of trend (i.e., have good shock value, which can power the new trend forward)?
- Consider Relative Strength and Weakness — the target issue should be In-Synch with Broader Market bias.
- Consider where the stock is gapping to and from relative to prior support and resistance levels on the daily and intraday (60-minute and/or 15-minute) charts
(e.g., prior pivots, prior day's close, and 20 & 200 MAs).
- Identify a good entry level, your stop-loss level, and your 1st (where you will sell half) and 2nd (where you'll sell more) profit target levels.
- This trade must be skipped if it does not offer up a low-risk (tight stop), high-reward opportunity.
- We must be able to find an entry vs. stop-loss spread that does not exceed 1R, while still offering a profit target of at least 2Rs.
- If the gap does not offer a great entry on the open, wait 5 minutes:
If you're bullish, buy above the first 5-minute high or a normal VBS, with your stop below the first 5-minute low.
If your bearish, sell below the first 5-minute low or a normal VSS, with your stop above the first 5-minute high.
- Never Scale into (ATM) a gap trade - these trades tend to make quick, powerful moves and thus require firm stop-loss levels.
- Exit, if the Stop-Loss price is seen on the tape or it is becoming clear that it will before too long.
- Exit, if any of the entry requirements are no longer valid.
- Exit, if we find a better place to spend your time and capital.
- If this trade, like most quality setups, fails, consider reversing the position as failed setups tend to yield big moves in the opposite direction.
But this decision to reverse should be considered before the initial trade is taken.
- Trend Continuation Trades
|
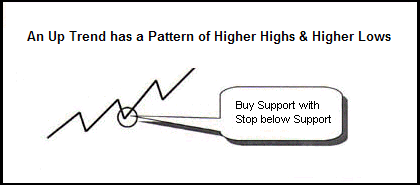
If we find a healthy up trend (see the associated idealized figure), we'll basically want to buy the dips and sell into the rallies.
Specifically, we'll look to enter long at the first sign of strength after a retracement (i.e., a bounce off support).
We'll place our initial stop-loss below the low of the current retracement (support level).
As prices move up, we'll raise our stop-loss to protect profits.
Refer to page 86 of my VCM Trading Manual for VCM Buy Setup (VBS) details.
|
|
|
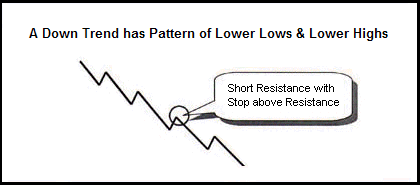
If the trend is down, we'll look to enter short at the first sign of weakness after a trend retracement (i.e., bounce off resistance).
We'll place our initial stop-loss above the high of the current retracement (resistance level).
As prices move down, we'll lower our stop-loss to protect profits.
Refer to page 94 of my VCM Trading Manual for VCM Sell Setup (VSS) details.
|
|
Primary requirements to enter this trade:
- We need to see a clear trend up or down on all adjacent time frames (e.g., daily, hourly, 15- & 5-minute charts)
that is has retraced back to the 20 SMA.
Each of these time frames must be bullish or bearish.
- In the current time frame (e.g., 5-min) we need to see a Buy or Sell Setup —
a (two to five bar) retracement towards the 20 MA, on lower volume, into a pivot reversal towards the broader market trend,
which is defined by the slope of the 20 period moving average in this time frame, and on the next two longer time frames.
- In the next longer time frame (e.g., 15-minute) we'd like to see a small bar power trend that's not too extended
or another Buy or Sell Setup.
- And in the longest time frame (e.g., hourly) we need to see no more than one or two 20/20 bar thrust out of a base or pivot in the direction
of the 20 period MA — we don't want to be too extended in this time frame or we'll be subject to a reversal move.
- The target issue should have relative strength — leading the Major Market Indices or at least its sector up or down.
- Avoid new setups in the direction of an extended trend at reversal time (9:35, 10:00, 11:15, 12:00, 1:30, 2:15, 3:00, & 3:30).
- Know your stop-loss requirements before entering this trade —
1 to 3¢ below the lowest bar in a VBS retracement and 1 to 3¢ above the highest bar in the VSS retracement
(I allow myself to kill this trade early, if other market indications like $TICK suggest that we're very likely to hit our stop).
The goal is to be able to find an entry vs. stop-loss spread that does not exceed 1R,
while still offering a profit target of at least 1.5Rs.
Primary requirements to exit this trade:
- Stop-Loss price is seen on the tape or it becomes clear that it will before too long.
If long, I'll place my initial stop just (1 to 3¢) below the prior bar (this pivot).
Once I've realized a two bar lift into profitability,
I'll raise my stop to just (1 to 3¢) below the current bar, and then use a bar-by-bar trailing stop-loss to take profits.
And if short, I'll place my initial stop just (1 to 3¢) above the prior bar (this pivot) — it's the mirror image of the long process.
If I get a Wide-Range-Bar (WRB), I'll use a 55% retracement of that bar as my stop.
One of our primary goals is to allow our winners to run.
So, if the 8-period MA is clearly providing support,
I can then use a two-bar violation of that MA to take profits;
and in a power trending market, I can use trailing pivots.
Once I shift away from bar-by-bar,
I'll sell some of my position into any trusting pivots,
and add these shares back in the retracing pivot — an Add and Reduce technique.
Whenever we get far away from the 20MA,
I'll switch back to bar-to-bar stops to avoid losing too much of this extended move.
In all cases,
if we get a WRB after a number of normal range bars,
I'll sell some of my position into this extended move (i.e., once it becomes clear that it's becoming a WRB);
and I'll use a violation of 55% of that WRB as my stop-loss for the balance of my position.
If the WRB becomes very, very extended, I'll use a 33% retracement for my stop.
- Any of the entry requirements are no longer valid.
- I find a better place to spend your time and capital.
Let's take a detailed look at a Buy Setup.
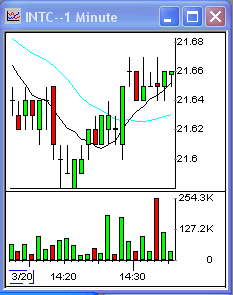
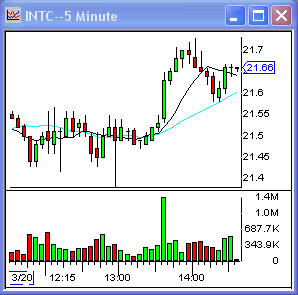
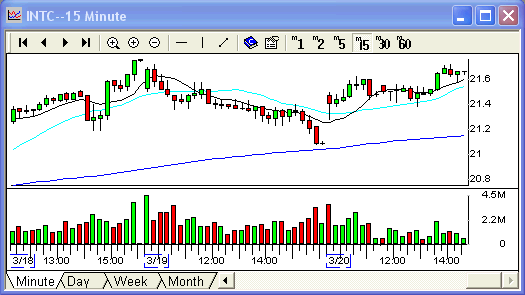
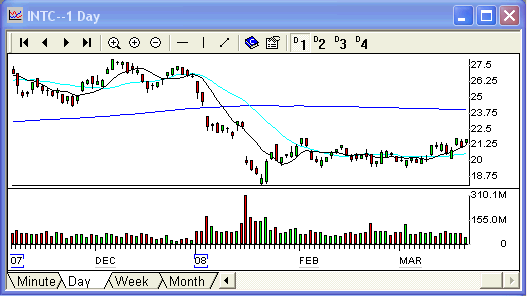
Consider the following charts of Intel, which show a Buy Setup on multiple time frames.
Note that the stock is in a primary up trend - the 20-period MA on the 5- & 15-minute charts is trending up
(it's also good to see the daily in an up trend too).
Notice that the moving averages are providing support on all of these charts.
We got a pullback of three to five bars, or so, into support on the 5-minute chart.
We then got at least one of the bottoming signs (Bottoming-Tail, Narrow-Range-Bar, Green-Bar-Reversal)
in an area of price support or after a 35% to 65% retracement.
We then see prices resume the primary trend as volume increases.
We buy this (the first) sign of real bullish strength.
 Note that the details of a Sell Setup are the inverse of the above trade (i.e., trend is down and we enter on a bounces off resistance).
- Base Continuation Play
A basis is also known as a Consolidation, a Price Range, and a Support and Resistance (S/R) Channel.
A base needs a minimum of 3 to 5 range bound bars, the more the better.
Note that markets tend to cycle between two phases or periods of rest (consolidation) and action (trending or thrusting forward).
These base plays exploit this behavior, and gives me two types of trades to play.
The first is a continuation of the consolidation (i.e., prices tend to stay mostly within the support and resistance channel).
The other is a break-out (a bullish move up) or a break-down (a bearish move down),
which is the beginning of a new action phase.
The primary goal of this trade is to buy support and sell resistance, and to take our stop-loss in any violation of the channel!
This approach supports the ATM type trade - scale in and out of the position.
The following rules govern this trade:
- Wait 30 minutes to an hour to let the day's trend develop.
- Trade in the direction of the trend on the next one or two longer time frames.
- Scale in and out of your trade (position) to earn lots of little, quick profits.
- It's all about average cost basis — try to keep it close to the current price action.
- Buy an area of support & Sell an area of resistance;
ideally, we'd love to catch a shack-out entry (a failed base-break).
- Goal is to catch the turn with half of your buying power (10 trades or less).
- If you have 20 entries into the position and your have not yet found the turn:
- You either started too soon,
- Scaled in too quickly, or
- The trade has gone wrong and now requires a Stop-Loss Exit.
- This trade (position), like every other trade, must not exceed your maximum trade loss amount,
which is or should be about 1/3 to 1/4 of your daily loss limit — 1 or 2 Rs.
- This trade, like every other trade, must also have a stop loss price — if the trade reaches this price, clearly the pattern is wrong!
- This trade, like every other trade, must have a time stop —
if the trade does not reach one of the two exit targets within a reasonable amount of time,
it should be abandoned to allow my trading resources to be applied to more favorable opportunities.
- The goal is accuracy — You should have Batting Average above .75 and Win/Loss above 1.
You should be able to go weeks without a losing day.
- Look for stock trading in the $20 to $50 range, with lots of volume.
Note that the higher the price range, the wider the channel.
Primary requirements to enter this trade:
- The target issue is trapped in a trading range — a support and resistance channel.
- If the Broader Market Trend is up, we'll enter long, else short.
Primary requirements to exit this trade:
- Price break out of the primary support / resistance channel.
- Any of the entry requirements is no longer valid.
- You find a better place to spend your time and capital.
- Base Breakout and Breakdown Plays
The primary goal of this trade is to enter the trade in anticipation of a break of the base,
with a stop on any indication that the base will break in the other direction.
This can occur on either one of the two following conditions:
If the break occurs when an MA catches and drives prices out, we can enter without a re-test.
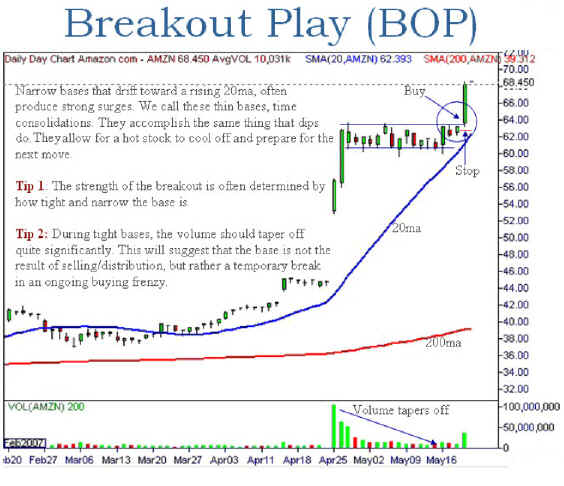 The alternative entry requires a re-test of the base that fails to re-enter that base;
that is, we enter on the successful re-test - the VBS or VSS.
Note that the bottom of the base provides support and the top provides resistance;
but in a breakout, prior resistance becomes support and
in a breakdown, prior support becomes resistance.
Consider the following figure, which shows a number of examples.
Note that tight, narrow bases tend to continue the current broader market trend
and that wide, sloppy bases tend to reverse the broader market trend.
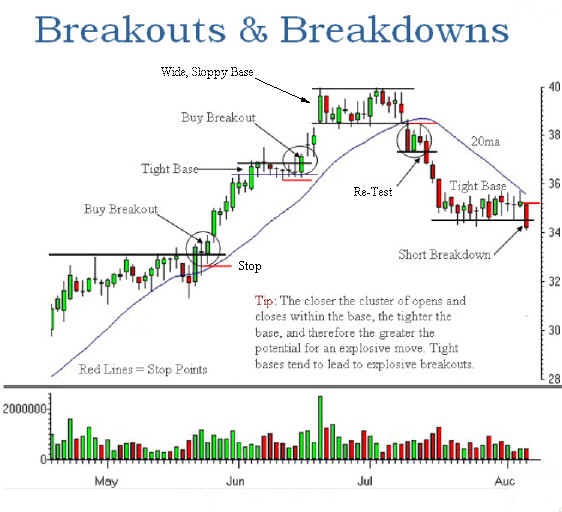 An ideal entry follows a Shake Out, which occurs for no apparent reason.
I like to play stocks that are Tier 1 or 2 Gappers,
that are forming a tight base after a nice trusting move,
and that are showing extreme relative strength in the face of the market moving in the opposit directions.
I prefer to scale in on any shack-out moves (false reversal breaks),
and then waits for the broader market to change,
which normally causes a nice continuation break of the base.
- Trend Reversal (Pivot) Trades
Trend Reversal plays tend to occur less frequently - something on the order of 10 to 20% of the time.
As a general rule the trend is most likely to continue after a small retracement or consolidation,
which may become choppy in volatile markets.
These reversals are most commonly called a "Head and Shoulders" pattern.
Recall that a normal up trend has a pattern of higher pivot highs and higher pivot lows;
and that a normal down trend has a pattern of lower pivot lows and lower pivot highs.
In a classic Head and Shoulders Pattern, we see the sequence of higher pivot highs followed by a lower pivot high,
where the highest pivot high is the head with a lower pivot high on each side, thus creating the shoulders.
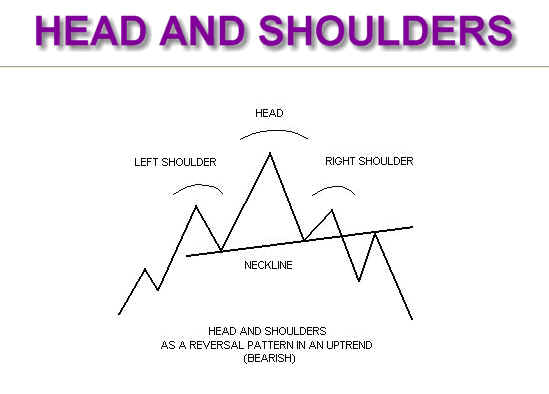
We can see the Inverse pattern on the other trend reversal.
The low-risk key to both reversal patterns is confirmation.
When an up trends fails to make a new pivot high, continuation of the up trend becomes questionable;
and once we put in a lower pivot high, followed by a lower pivot low,
we have confirmation of a trend reversal in that time frame.
The reverse is true for the inverse pattern too.
And finally, the head can be either a sharp, high-volume "Climactic Reversal"
or the less common, failed consolidation pattern that does not continue the current trend
(refer to Wide, Sloppy Base in Trend Consolidation above for more information on this pattern).
The best Climactic Reversals occur after 5 or more bars that have accelerated away from the moving averages on above average volume,
and that are punctuated by a reversal pattern (e.g., 180s, tails, or narrow bars).
Consider the following chart of Climactic Decline Buy (CDB), which should a nice Bottoming-Tail (BT):
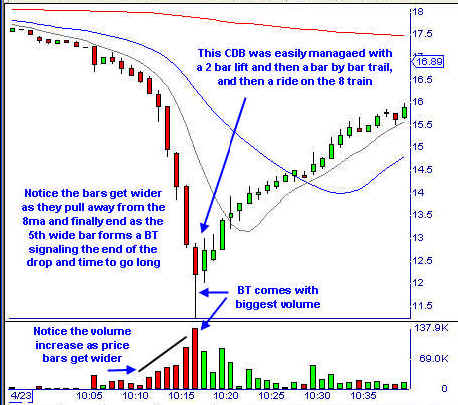
The primary goal of this trade is to enter our new position in the direction of the new trend after seeing the creation of the second shoulder,
which is confirmation of the trend reversal.
We'll place our stop just beyond that shoulder — 1 to 3¢ violation.
Please note, we need to expect an explosive move in the direction of the new trend after confirmation
because everyone knows this pattern and when the crowd jumps in, we're likely to see a big move.
From this point forward, we're in a Trend Continuation play (see above for details).
If we see a Climactic Reversal,
we can anticipate the confirmation move and
enter with just a 1/5th to 1/2 of our planned position after we see a 55% retrace of the climactic bar
(e.g., the bottoming tail in the figure above),
and place a hard stop 1¢ beyond the end of the climactic bar.
Thus any violation of this reversal move will take us out of this low probability trade —
any failure of this can result in another big move in the prior direction (think GBI or RBI).
We'll add to our position after we get confirmation — creation of the new shoulder;
and we'll move our stop to cover a violation of the new shoulder.
- Buy Support and Sell Resistance Trades – Swing Trade
Stocks spend most of their time trapped in daily and weekly trading ranges
that reflects the market's collective view of fair value.
This swing trade is actually a longer-term combination of Trend Reversal and Trend Continuation trades above
(refer to those trades above for details).
We should always prefer to take these trades in the direction of the weekly trend,
although there are times when a counter trend trade will work too
(e.g., when the weekly trend is overdone and showing signs that it is ready to reverse).
- Earnings and Dividend Capture Trades – Swing Trade
Stocks will often rally up into an Earnings Report and the Ex-Dividend date for a few days,
and then after the report, assuming no big surprise, and on the Ex-Dividend date
stocks will sell-off for a few days.
Assuming the stock is appropriately placed within the weekly trading range
(i.e., we're rallying from support and selling-off from resistance),
these two predictable moves offer the swing trader
as nice longer-term example of Trend Continuation trade above
(refer to that trade above for details).
My Post-Market Trading Routine
After the market closes, I perform the follow tasks:
- If not already done, record all my trades (update my spreadsheets) and
update my financial records (update my Trading Journal) based on the day's 4:00 PM closing values for my overnight holds.
- Analyze my Trades. It is important to understand what I did right and what I did wrong.
Put a chart of each trade (or a good sample of each type of trade) in my Trading Journal; and
for each chart (trade) I need to:
- Name the strategy in my trading that I used to manage the trade.
- Identify the theoretical (ideal) entries, exists — initial & trailing stops, and profit target(s)
- Show the actual trades.
- Now grade each trade - Good, Bad, or Ugly
Win or lose, a Good Trade is backed by a strategy identified in the plan and was traded according to plan.
A Bad Trade is any trade run by the Trading Idiot, which was unplanned and in response to the emotional stimulus of the moment.
An Ugly Trade is one that was backed by a plan;
but executed by the Trading Idiot because the plan did not address the evolving situation or because you lost the self-discipline to work the plan.
Job 1 is getting rid of my Bad Trades and then the Ugly Trades;
a failure to do this will put me out of this business.
Stan Benson
 .
It is critical to maintain an asset allocation that is in-synch with the health of the current economic trend.
The current boom-and-bust (recovery-and-recession) cyclical phase of the Business Cycle is the most fundament factor affecting every investment.
Riskier securities (investments) like equities (stocks) and corporate debt (bonds) always do better when the economy is in recovery (booming)
and defensive issues (securities) like government bonds always do better when the economy is in recession (busted).
The best source of free simplified (boom-bust) economic data is from the ECRI's Public Indexes web page,
and a good source of free consolidated information is from www.TradingEconomics.com.
Unfortunately, the economic data is always backward looking and subject to revision;
but fortunately, the economic trend is very slow moving
and very likely to continue for many months and even years
until the news in the popular media cannot be justified by any rational economic reality
(e.g., a bull-market uptrend will end after growth rates have risen to an unsustainable high,
interest rates have risen to levels that make top-quality bonds a better risk-adjusted alternative to equities,
and great news fails to usher in yet another new market high;
and a bear-market downtrend will end after equities have been priced for Armageddon,
interest rates are effectively zero and underperforming top-quality equity dividends,
and more miserable news fails to deliver yet another new market low).
There are the two very important things that need to be understood about investing with the health of the current economic trend.
First, the (red) stock market cyclical trend always leads (anticipates) the (green) economic trend (as seen in the figure Sector Rotation Model)
 ;
and second, you don't have to catch (time) the actual turn in the economic,
just keep your investment allocation in-synch with the broader economic trend
(here's the tell —
if your investment keeps losing money (no matter what you do),
your investment is simply not in-synch with the broader market trend —
get out and find a better place to invest your money).
Right now, we're in weak economic recovery mode.
Interest rates have only increased a little bit in anticipation that the Fed will do that next —
in fact the Fed has yet to start or even talk about starting.
Bottom line: This should be a good time to invest in risker issues, like stocks and corporate bonds.


