Professional traders scale in and out of their positions and so should you. In an ideal world, we would buy the bottom and sell the top of the current trading range. But we don't live in an ideal world; and the truth is, only liars are able to do this on a regular basis. Break-up the buying and selling power allow us to convert the single buy and sell prices into two averages that can be managed and optimized (i.e., turn the buy low price into an average Price per Share and high price into an average Rate of Return). Professional traders know that the two biggest factors affecting their success is: 1) their ability to trade with (in the direction of) the broader market trend, and 2) their ability to effectively manage these two averages.
So what is scaling in and out, which is also known as averaging into and out of a position? It is a trading strategy that allows you to build a position based on a number of buys (or sells in the case of a short position in a down trending market), where each subsequent buy (ideally) requires bigger size and/or wider distances between buys (replace "buys" with "sells" when shorting a bearish position). This approach causes the average (and break-even) price of your position to be closer to the current market price as your position realizes a drawdown. Let's take a look at an example trade.
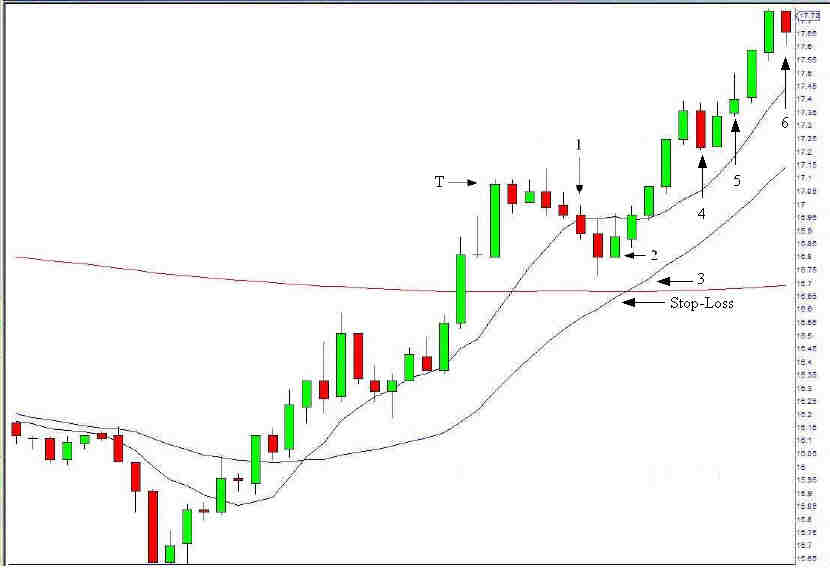
In the following chart, we see a stock in a new power uptrend. After putting in a nice bottom (nice because we see a sequence of growing red bars, ending with a wide range bar, which suggests that this pivot is a primary trend reversal) near the lower left of this chart, we see prices trust up to and then through the 8- and 20-period moving averages. Prices advance and retrace, finding support on a rising 8 MA, which is a good example of a healthy uptrend, one that is likely to continue. After prices trust through the flat 200 MA, We decide to scale into the next retracement. Here's the trading plan:
Enter (start) a new long position with a 100 share buy off a bounce off support on the rising 8 MA (see arrow # 1 on the chart). If that support level does not hold, we'll look to scale in (add 150 shares) to this position on any support level half way to the flat 200 MA and the rising 20 MA (see arrow # 2). And if that support level does not hold, we'll look to add (250 shares) one last time on any bounce off the flat 200 MA or rising 20 MA (arrow # 3). If prices break down through the convergence of the flat 200 MA and rising 20 MA, we'll close the position — our stop-loss point. Our initial profit target will be above the prior pivot high (arrow T on the chart); and once prices trade above this level, we'll close the whole position on any retracement below this target level. Once above this level, we'll start to scale back out LIFO style on any new pivot highs (arrows 4, 5, & 6) and sell the balance on any violation of a failed uptrend pivot — an uptrend is defined as a sequence of higher pivot highs and higher pivot lows.
Here's a detailed break-down as this example trade progressed:
If we were to take this trade on a traditional basis (not by scaling in and out), we would have taken a single buy entry somewhere between arrows 1 and 3, with the same original stop below the flat 200 MA. Here's the problem, the quicker (higher) the entry, the more likely we would be to get into this trade, but the more we would risk (lose) if our stop-loss point is hit. The more patient (better lower priced) entry would be closer to the flat 200-MA; but the less likely we would be to get into this power trending stock.
The big advantage is that you are more likely to get into a power trend early. But, if that initial buy is subjected to a full retracement, we're given the opportunity to build a bigger position with a better cost basis. Furthermore, if the position is stopped-out, that loss is relatively smaller because the biggest commitment of capital occurred just before the stop.
The big disadvantage is that this approach requires a lot more trading, and therefore requires the lowest possible commission rate structure to minimize trading expenses.