VCM Weekly Trading Lessons
The Shake Out
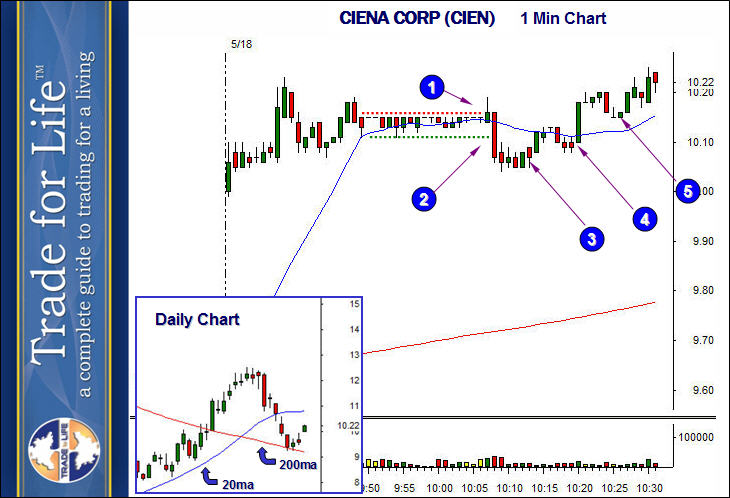
New traders go through many phases, as they are learning. Take the subject of stops, for example. Most new traders do a poor job with stops. They take trades that do not have good entries, use stops that are too tight with too much share size, and then get stubborn about getting out, because the loss is getting ‘too big’ to take. As they progress, they learn about share sizing, and the importance of stops, and start curtailing the ‘big losses’. Then they move up a level toward being professional traders, and they start to learn about avoiding entries that are prone to stop. Then for some, the next level hits. They learn to actually profit on trades that use to cost them money. Take a look at the one minute chart of CIENA CORP. (CIEN), below.

CIEN was a strong stock, as it gapped out of a daily buy setup, and held strong all morning. It closed strong. Yet, the odds are, many traders lost money on this. Why? See if this sounds familiar. You find this stock basing near the high with great relative strength. A very tight base forms. You watch and pounce on it as it breaks over the top of the base (1). You have a very tight stop, so you love the play as it starts to move up and make you money. Then, you find yourself stopped out (2). Worse yet, if you missed your stop (that should NEVER happen), it keeps dropping and the pain is too much, so you sell at a big loss. An hour later, you run across the stock, and it is higher than what you originally paid. Aggravating? Worse yet, most traders then go out the next day, and do the exact same thing, hoping the results will change.
Sometimes, the stock will break out of its base and keep going. Many times, they have to ‘shake out’ first. How do you know which it will do? The truth is, you don’t. Sure, some bases are better than others, but even good bases shake out sometimes. So what is a trader to do? Decide how to play these and stick to it.
Note, when being more aggressive, you want more information that this is a shake out. The best scenario is to have a strong stock on the bigger time frames, which is also strong on the intraday charts, in the upper part of its trading range, with a strong market. The selloff should look like a ‘fluke’, not the result of an extended stock or weak market.