VCM Weekly Trading Lessons
When Time Frames Collide
There are many common sayings in trading that do not actually hold very much truth. They seem to be myths that are promoted throughout the years, or at the very least, they are often ambiguous and useless statements. There is an exception however; the oldest saying known to trading is perhaps the truest. The longer you trade, the more you will come back to know that "the trend is your friend". The most accurate strategies we teach here at Velez Capital Management (VCM) revolve around this concept.
However, it is also true that all good things must come to an end. In other words, no trend goes on forever. So one of our jobs as traders is to see the signs of when the trend may be ending. Now there are two important caveats that must be mentioned right here and right now. The first one is that when you have a really nice trend in place, your best bet is to continue to play that trend regardless of anything else that is going to be discussed here in this article. More mistakes are made by assuming a trend will end prematurely, without sufficient evidence to back it up. The second important point to make is that the identification of a trend ending is not necessarily cause to play against the trend; it is only a reason to exit positions and stand aside. It is against the odds to play against the trend, and trying to form a countertrend bias too early is perhaps the most common mistake made by traders.
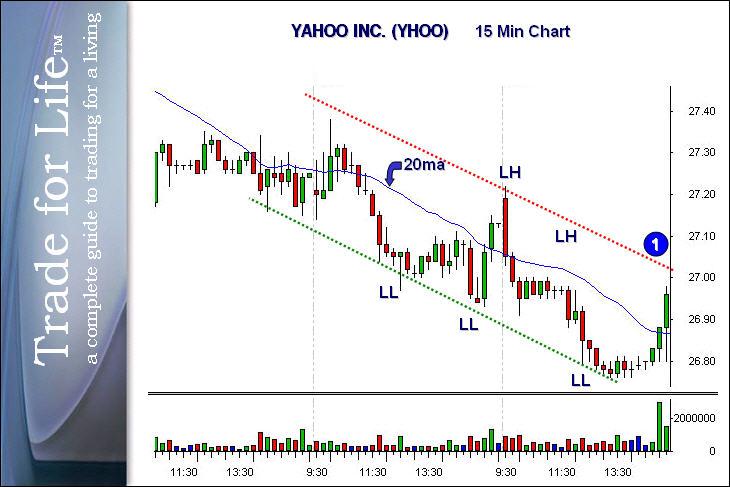
When the trend was choppy to begin with, and we start to see signs that the trend may be ending, it may make good trading sense to greatly reduce the size of your positions, thus reducing your risk exposure, while keeping the odds on your side; and look for opportunities to profitably exit, and to stand aside at some point, rather than continue to play the a questionable trend. One of the most important signs of the trend ending may be found when a larger time frame begins to come into play, and the trend of the bigger time frame is going to be against the trend you are playing. If that sounds confusing, let us take a look at an example. Here is the stock Yahoo Inc. Yahoo (YHOO) shown on a 15 minute chart, with a downtrend that was very shortable during a downtrend.

Without over analyzing things too much, we see this stock has been weak and has been in a downtrend on this 15 minute chart. This is evidenced by the series of lower highs (LH) and series of lower lows (LL). We also see a steadily declining 20 period moving average. This trend is a little sloppy because the price pattern is not reacting to the declining 20, rather the 20 has been interwoven inside the middle of the price channel. Nevertheless, this is a playable downtrend on this 15 minute chart. The question now is, “Is YHOO shortable, as it approaches the $27.00 area at "1", which is going to represent the downtrend line?”
The astute trader has probably already noticed one of the signs. This last counter rally has some significant serious volume attached to it. Notice the last two wide green bars in the chart. They are more than double the average of all the bars on this chart. Is this alone enough to stop playing the trend? What is causing this volume surge in the middle of a fairly straightforward downtrend? Here is where a look at a bigger time frame can help provide an answer for us.

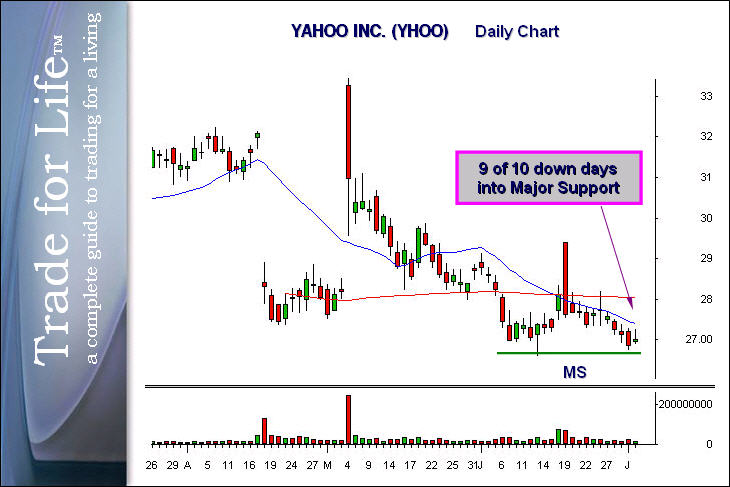
This is the daily chart of YHOO. As you can see here, at the time of this last low on the 15 minute chart, the daily chart was retesting a Major Support area. We call this Major Support in this case because a significant and substantial rally developed from the last low, in mid-June. Notice, also that the bar that tested the low was the widest red bar in a 10 (almost) day decline. This type of setup is VERY likely to bounce. Whether or not it is playable on the daily chart is another discussion. Again, the question at hand is, “Is it time to stop playing the 15-minute chart?” We can see the effect that happened the next day.

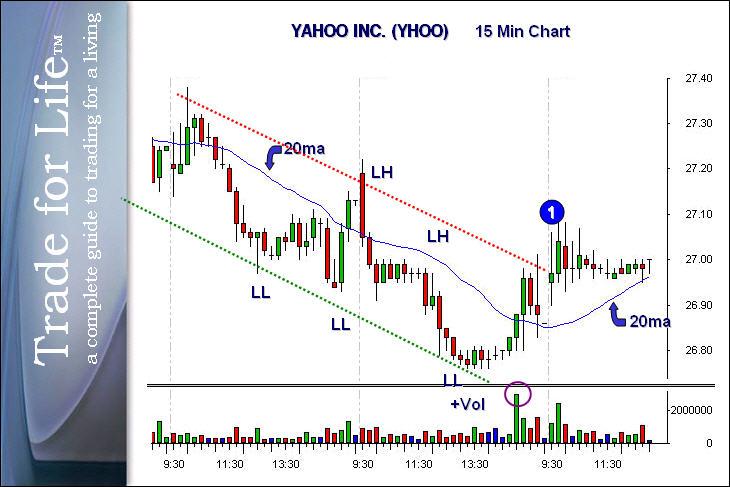
At “1” the downtrend line was broken, and there was significant volume during the entire last move up. We are now consolidating in the upper part of that last rally, above the downtrend line, and we are now suddenly above the rising 20 period moving average. The odds are changed, and the likelihood is that Yahoo will begin a move to the upside, once it breaks over that 27.00 to 27.10 area
The rule to learn: Play the trend, until it conflicts with a bigger time frame. Using these tactics that we teach at our seminars, and in the VCM Trade for Life™ Live Trading Room everyday can keep you on the right side of the market and the trades you do.