Weekly Trading Lessons
When is a Change of Trend Worth Playing?
Rule number one in trading is to follow the trend. While an occasional strategy can be used to exploit a move against the trend, this should be saved for experienced traders, who prove that they can consistently make money doing it. For most new traders, the single biggest mistake comes from fighting the trend, no question about it.
So, lets assume we all know what a trend is. Waiting for a solid trend to be established is the safest thing. However, trying to get in at the earliest moment in a new trend can be a good thing. Why? It is often the case that the first move in a new trend is the biggest.
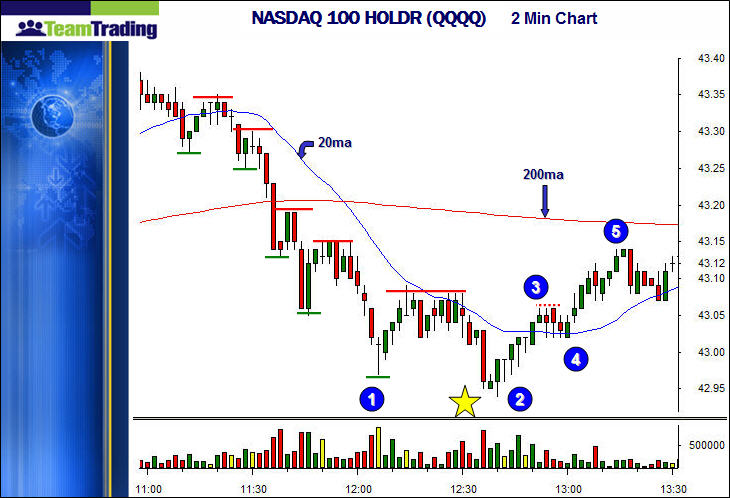
However, not all trend changes work, and some do not go far. How do you increase your odds of getting in early, and getting a big move that does not fail? Lets take a look at a two minute chart below, of the NASDAQ 100 HOLDR (QQQQ).

Starting on the left side of the chart, we are clearly in a downtrend. We have a declining 20 period moving average (20ma), (we have a declining eight period moving average also, but it is not shown to keep this chart cleaner for educational purposes), and a series of lower pivot lows (green lines) and lower pivot highs (red lines). Traders shorting all the VCM sell setups in this trend would be doing well. Lets take a look at how the trend changes first. This will help to show, first, when to stop shorting, and second, when to start playing long, on both an aggressive and conservative level.
Lets start at the number 1. This is a low in the current downtrend. Notice that this low was at least the fifth lower low, and it became the furthest from the 20ma. This is often a clue that the end is near. The next rally hits the 20ma, and the next decline to 2, barely sets a new low. Again, this is another clue. The next rally, to 3, challenges the last high, making barely a lower high. Once this pattern reached 4, the area at 3 became a pivot, and trading above that area breaks the downtrend. The price rallies.
Now, a couple of observations. Notice that while the downtrend was broken, it is not a well established uptrend yet, between 3 and 4. So playing that move is very aggressive. If it works, the first move is often a big move (for a two minute chart, the move from 3 to 4 to 43.12 is big), but it also may not work, because we are not in an established uptrend. What can a trader look to, for help in deciding whether or not to play this pattern? Take a look at the chart below.

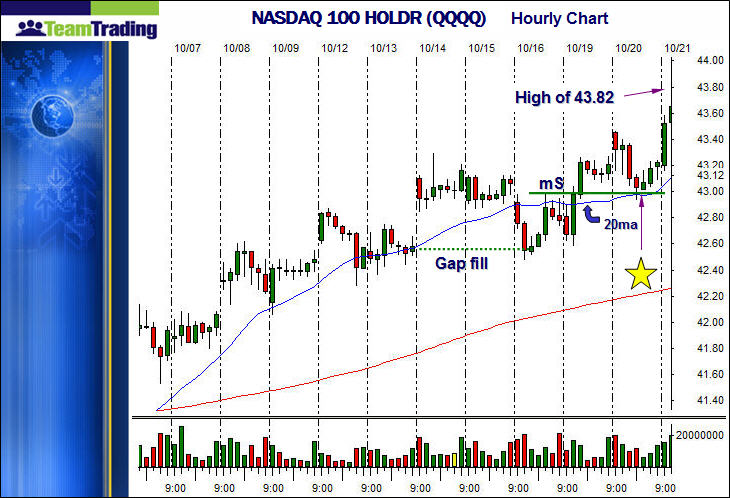
This is the hourly chart. The gold star is in the exact same place as on the two minute chart. What was happening here? The change of trend on the two minute chart was happening as a result of a VCM hourly buy set up forming. This VCM hourly buy setup formed in an uptrend, on minor support (mS), at the rising 20ma.
So, while the two minute chart had a change of trend, knowing where you are on the hourly chart will give you much more confidence to play that change of trend early. Also note, that the possible move on the chart was all the way to 43.82 (the next day, or about 43.60 same day), rather than just the 43.12 high on the two minute chart.