VCM Weekly Trading Lessons
Uses of Pivots
In the last two lessons we looked at ‘pivots’ and how pivots are used to help determine trends in a very precise manner. We had a lot of compliments on the lessons, and some requests to expand on the topic with real charts and discuss other uses of pivots.
The most important use of pivots other than determining trends is to use them as a method of trail stopping positions. In a sense, this is redundant with their use as a trend tool. We say that, because if you want to trail a position and give it the most room possible; in other words, you want to be in the position as long as possible, you would stay in that position as long as the desired trend stayed in place on the time frame you are playing. This means that using pivots to trail a position is the same as saying that you will stay in the position as long as the trend is in place. Pivots are not the only method of trailing positions; it is just one of several methods. Let us look at an example.

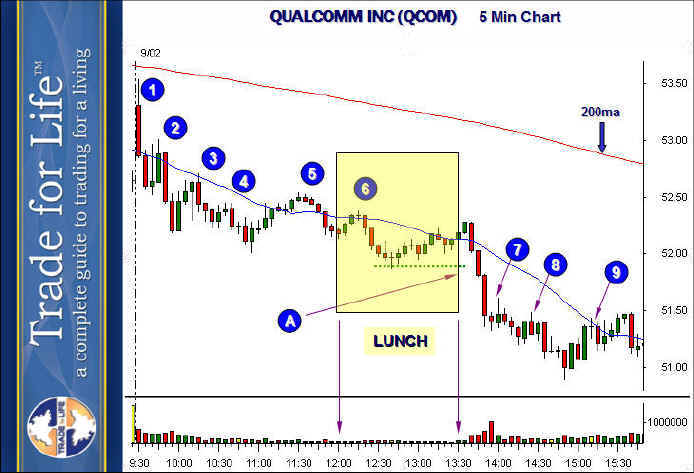
Let us say you shorted the opening gap of QCOM at ‘1’, because it was a bearish gap, or you could have shorted at ‘2’. Either way the issue is how long you could stay in this trade, as a day trade, if you felt it was going to fall most of the day. The numbers 1-9 represent the various ‘high pivots’ that formed throughout the day.
Notice that pivots 1-4 are all ‘lower high’ pivots, which kept the stock in a downtrend throughout the morning. Every time a pivot formed, the trader could lower their trail stop to that pivot. For example, at ‘2’, once the long red bar closed, that made a bar with a lower high on both sides of the highest bar, so the stop could be lowered to ‘2’ at that time. This would continue at ‘3’ and ‘4’. Then, the rally to ‘5’ made a higher high, so profit would have been taken as the stock traded over the high at ‘4’.
Between ‘5’ and ‘6’ the stock is neutral, sideways, as a lower high formed at ‘6’, but a higher low pivot (not marked) formed just before ‘6’. Also note the shaded area. This is the doldrums. This is lunchtime where stocks often wander without any real direction. It is best to not try to find an entry until after lunch. The downtrend resumes at ‘A’ as the price falls below the last low pivot (green dotted line). Lower pivots are formed at ‘8’ and ‘9’ as the stock goes into close.
Notice a couple of things. Using five minute pivots in this case would have kept you in the position most of the day, but you would have exited at lunch. Also note that you give back profit if you are actually taking all your targets by letting the position trail stop for every target. It is better to have targets you are achieving, and to just use the pivots to ‘lock in’ profit in a worse case scenario. It is also an excellent idea to let half the position trail with pivots, while using to other half to take profits on every 3-4 bar drop, and re-entering the half position on every new sell set up (every pivot in this downtrend was a sell set up also). This lets you take maximum profit on every decline, and keep half for the bigger move if it comes.
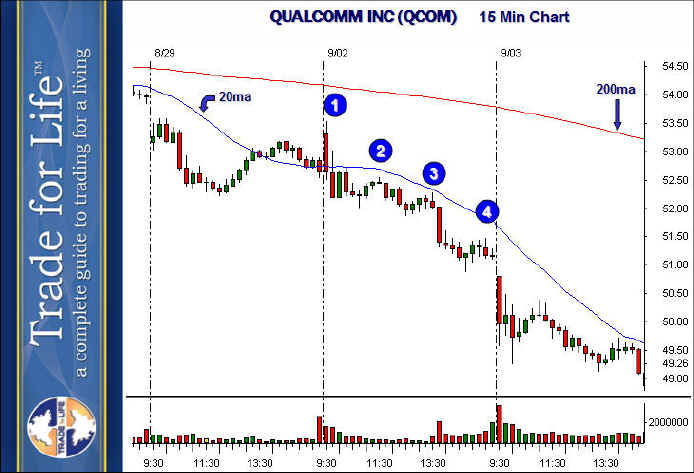
Also notice, that if you want to stay in for the whole day or longer, using five minute pivots is not good enough. It is rare, very rare, to hold a trend on a five minute chart through lunch, into close, without breaking the trend once. The above chart almost did it, but it is rare to find. If the intent is to day trade the stock, and be in it at close if at all possible, use the fifteen minute chart. Below is the same stock, same day, on a fifteen minute chart.

Notice now, we only have four pivots. Each one forms a nice ‘lower high’. Notice how much smoother the trend looks. It keeps the stock nicely under the declining 20 period moving average, and makes you wonder why you would ever exit (the five minute chart has you exiting once). Here you are in the stock from open to close, capturing the entire move, with fewer transactions and stress. Naturally, this method works best if the stock continues a nice trend all day, but will also give more back IF the stock breaks trend on the fifteen minute chart because the prior pivot will always be further away.