VCM Weekly Trading Lessons
Timing With the Market
If there were a subtitle to this lesson, it would be, “the difference between ‘good’ relative strength and ‘bad’ relative strength”. Not much unlike good and bad cholesterol, relative strength (RS) and relative weakness (RW) can come in two flavors. One can be very good, and one can lure unsuspecting traders into bad trades. We will look at the RS-RW lesson in next week’s lesson. For now though, let us examine a very often asked question; if you are going to take a trade, do you care about what the market is doing; and if yes, how do you account for it? Both answers are simple. You do care what the market is doing and you account for it if your trading plan says you should. The natural next question is, ‘should your trading plan account for this issue?’ The answer is a resounding ‘yes’, it should. Let us look at some guidelines of how you may want to work this aspect of trading into your plan.
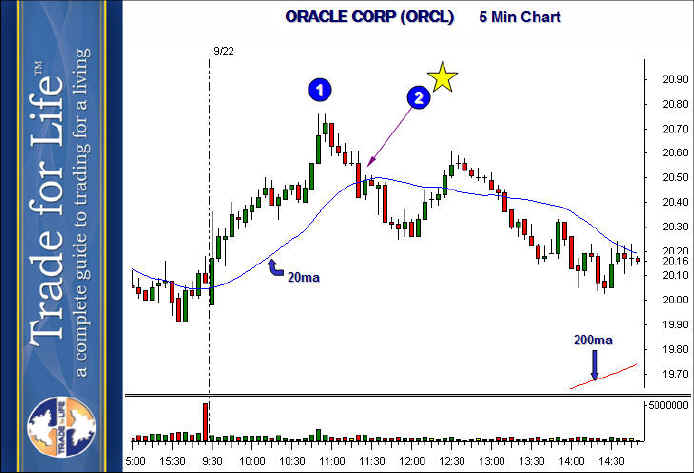
Below is the five minute chart of Oracle Corp. (ORCL). The focus of our attention is going to be the VCM buy set up (VBS) at ‘2’ (where the yellow star is). There are many aspects of this set up that could be examined, and the result may be that this trade may not be the best set up. But it may qualify for a long entry for many trader’s trading plans. The question is, how do we incorporate a rule about the market that can help us be a better trader. In this case, we want a rule to help us ‘avoid’ this trade, because it would have stopped out.

Your plan may have allowed this play because there were many bullish aspects here. We have a nice uptrend, increased volume on the last down bar, extreme relative strength when compared to the chart of the QQQQ below (more to come on that one next week), a pullback to minor support and the rising 20 period moving average.
So how do we incorporate a market bias? First of all, there may be many plays that don’t require a market bias. These would be stocks that are ‘own their own page’. Many stocks gap a large amount, or have violent moves intraday due to news or events, or unknown reasons. These often will trade without any notice of the market. Also, many stocks are part of sectors that are not part of the normal market. For example, gold, oil, and energy stocks. These sectors don’t follow the market, and they often go inverse to the market. If they follow anything, they follow their own ‘market’. For example, when trading gold stocks, you may look to ‘GLD’, which is the ETF (Exchange Traded Fund, a sort of ‘tracking symbol’) for the price of gold. However, if you are trading a normal ‘market’ stock, the pattern of the QQQQ or the SPY (sometimes called a ‘bias’)should be incorporated in your plan.
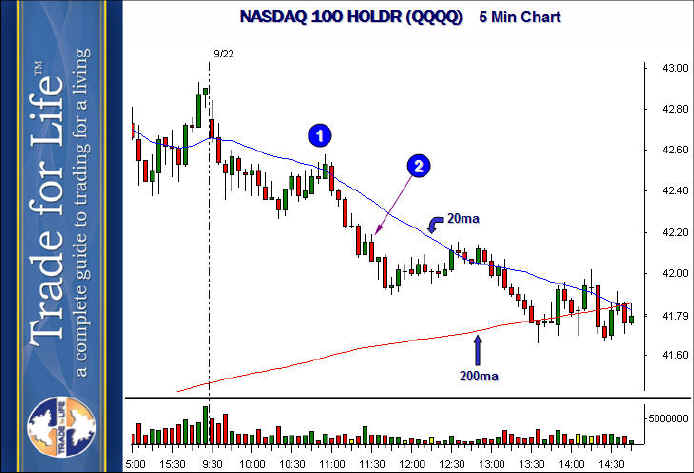
There are many different ways to use a bias. They start from a very simple rule, and can get more detailed. For example, your plan may state that in order to take a long trade, the QQQQ or the SPY (or both) must be ‘green’ on the day. That is, they must be up from yesterday. Or you may allow the ‘market’ to have a green daily bar as an option. Your rule would be very simple and state as a requirement to your long set up, you require the QQQQ to have a green daily bar at the time of entry. You may get a little more specific, and require the 15 minute chart to be in an uptrend, and define what an uptrend must look like to qualify. You may also be more demanding and require that the ‘same’ time frame you are playing on the stock, be in an uptrend on the market. Or you may require all of the above. Take a look at the pattern of the QQQQ at the time of the contemplated ORCL trade.

The numbers ‘1’ and ‘2’ match the first chart exactly in terms of the time of day. Note the great relative strength of ORCL at the time of ‘1’ on the chart. ORCL ‘blasted off’ to hit the high at ‘1’. The market rallied, but notice it failed to make a new high. It stayed under the last pivot from 9:50 in the morning. At the time ‘2’ arrives, we are contemplating the purchase of ORCL on a VCM buy set up. Notice however, that any type of rule about the market would have you passing this trade. Why? Because the market is now in a five minute downtrend, red on the day, and under yesterday’s closing price. While occasionally some stocks may defy this rule, you will find that this rule will save you a lot of money.