VCM Weekly Trading Lessons
The Surprise Gap
Both of our last two Lessons of the Week discussed ‘reversal patterns’. Two weeks ago, we gave an example of a ‘failed breakdown’, and how that led to a reversal. We also mentioned some of the other ways stocks can reverse. We received comments and questions, so last week we showed how a ‘monster gap’. Once again, we are going to show one more example of a reversal. This week, we will add a special treat of looking at the actual entry that can be used on an intraday basis.
As a reminder, here is the comment from two weeks ago. “Playing reversal patterns can mean many different things to different traders. The very term ‘reversal’ tells us two things. First, it implies a change of direction, so we should look at this topic with squinted eyes. We know the odds are always with following the trend, and playing in the same direction of the color of the daily bar. Second, we know that most new traders want in, even though they should not. New traders like reversals, because there is a certain sense of ‘heroics’, finding the top or bottom. But the truth is, it is usually a loser’s trade.
However, knowing reversals is still important, even if it is to know when NOT to take a trade, or when to lock profits in on a good trade. Sometimes, we may want to play a ‘reversal’ as an entry. They can happen in almost an infinite number of ways. Most of these are not recognizable, therefore, not playable. The truth is that most of the time, when a stock DOES change direction, it does so for no apparent reason. However, sometimes, that change happens in a way, and in an area, that we can notice the change as ‘soon as it happens’. Sometimes, the reversal is ‘climactic’. Both of these have been topics of prior lessons. There are also other ways, such as ‘shock value’ that can happen on a gap, or by a failure. Today, we want to look at an example of a ‘failed breakdown’.”
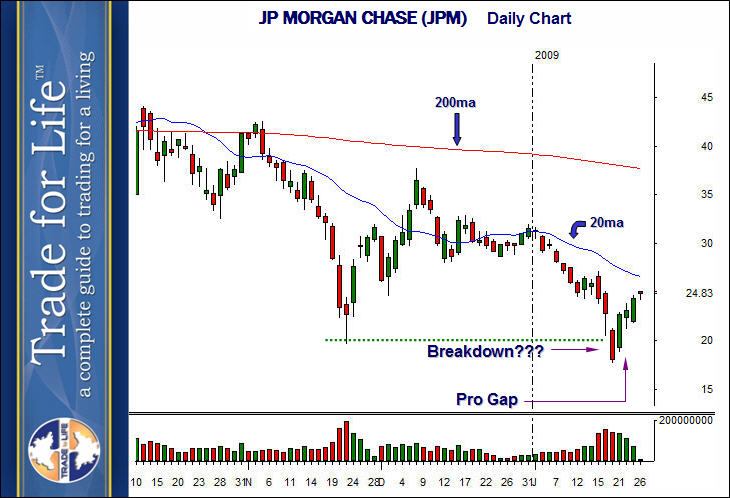
So let’s look at a daily chart, that combines some of the virtues of both the examples of the last two weeks. Below is the daily chart of JP MORGAN CHASE (JPM).

We see a stock that recently went into a downtrend, and that last red bar broke down hard below that last support level from late last year. This brought on heavy selling, and a wide red bar. The next day, the stock ‘half gapped’ and ‘half traded’ over the prior bar’s high. That prior bar was a bearish red bar. This again, delivers ‘shock value’, and we see the stock rally. This gap is known as a ‘Gap Up Surprise (GUS). This two day pattern is also a form of a ‘bullish 180 reversal (+180). As a swing trader, this stock can be played long for 3-10 days (this stock went to a high of 27.77 over the next 6 days). Next question. Can we find a better entry for a swing trader, and how can an intraday player play this?
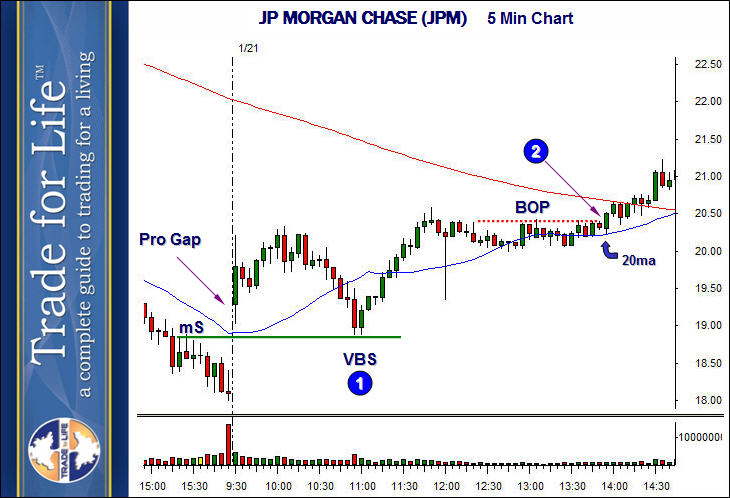
Below is the five minute chart from the day this stock gapped up.

The gap up can be seen at the beginning of the day. On any large gap, we want to play the pullback for an entry. We want to see the stock hold a support level, above the total gap fill in most cases. We want to see a clean VCM buy setup (VBS) on the five minute chart. Here we have the stock holding a minor support (mS) level, above the gap fill, and completing a nice VBS at ‘1’.
Also, note that if you waited, or missed the first entry, there was another opportunity. Since we are bullish on this stock, any bullish intraday setup can be played. Notice the breakout play (BOP) at ‘2’. This gave another excellent entry opportunity, for either an alternate swing entry, or a nice day trade.