VCM Weekly Trading Lessons
Signs of a Power Trend Ending
One of the basic tenants of trading is “the trend is your friend”. One of the best concepts we teach is to find trends that tend to go on for long periods of time. There are certain criteria we look for and are called ‘power trends’. When found they often produce VCM buy set ups (VBSs) and VCM break out plays (BOPs) for extended periods of time. Basically, the rule is to play the trend until it fails. That is a good rule, because more often than not the trend continues much longer than most traders guess. The same applies to power downtrends, but for simplicity this article will discuss uptrends.
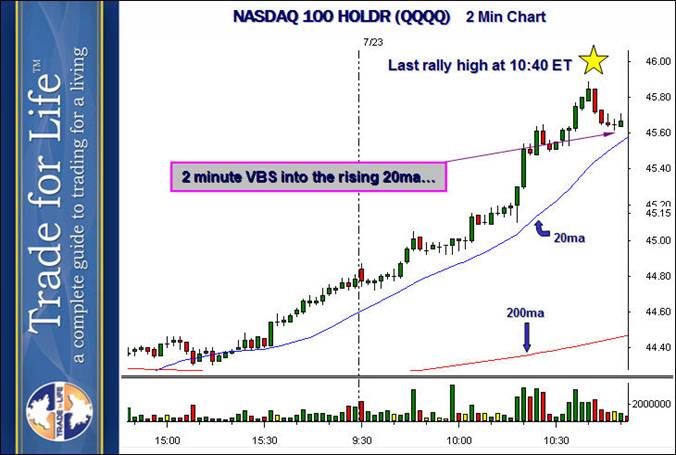
Below is an excellent example of a power trend. It is the market itself, shown through the QQQQ, on a two minute chart. We are evaluating the set up with the arrow pointing at it. The prior high is marked with a star on all the following charts so you can coordinate the charts.

We have all the requirements met for a nice looking VCM buy set up on this pullback inside this power trend. The pullback is happening before 11:00 a.m. ET so there is not an issue of trading into lunch. As you might guess by looking at the title of this article, this setup is going to fail. And it is not by chance, we are going to show you the signs to look for to understand why the setup is going to fail. Let’s start by moving up one timeframe to the five minute chart.

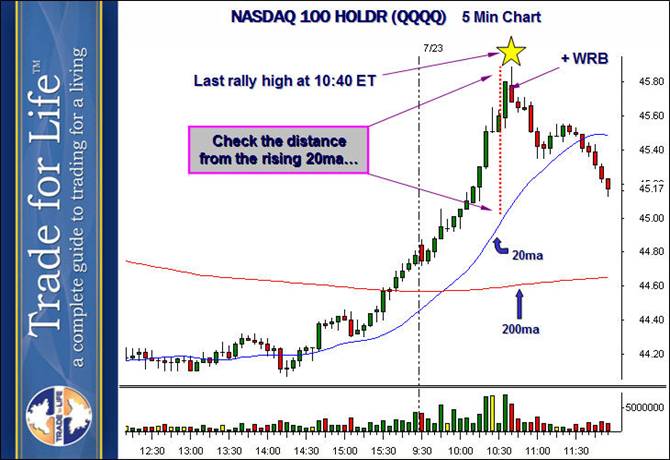
While each time frame is naturally interrelated, they are all very unique as well. As we look at this five minute chart we can notice a couple of things. First of all this uptrend began at 2:30 p.m. ET the prior day. That in itself does not mean much because as we stated, good trends can go on for very long times. What must be noted is what we call the rate of acceleration of the price pattern. This can be most easily measured by the distance between the price and the 20 period moving average. Notice also that the biggest, widest green bars are coming at the end of the move and with significantly larger volume than the prior bars. This is a sign of a climactic or novice move that tends to end trends. While there is no magic formula for determining how far it is "too far" from the 20 period moving average, the trained eye begins to learn the accelerated movement that began after the price pattern was already extended. At about 10:15 a.m. ET you can see the price slowly pulling away from the 20 period moving average. This is when many traders begin to feel that this stock is ready to short. Sometimes stocks roll over in that situation, and sometimes they don't. The better trade comes when the accelerated move happens after the price pattern is already extended to the average eye. Let’s look up one more time frame.

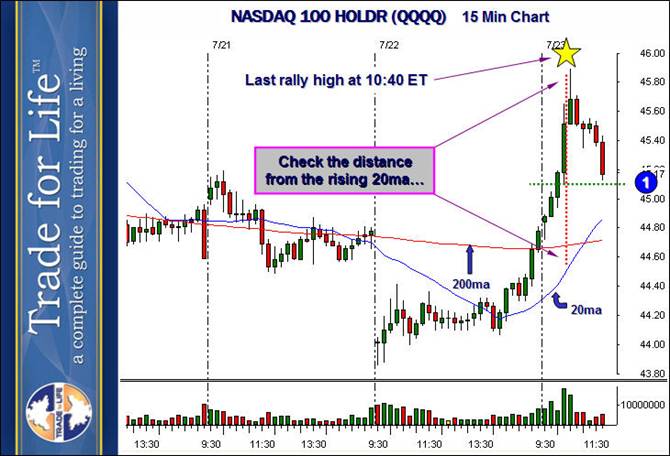
This is exactly what we want to see to confirm our suspicions. The price pattern here could be subjectively called "parabolic”. The 20 period moving average can barely be seen by the price pattern at its high. Remember, that star is the same star in the same position on the two minute chart. It is that pullback that was being considered for purchase back on the first chart. Another clue is to know where a 15 minute pullback would likely occur. Notice that the area marked "1" is actually sitting on minor support from two days prior. Notice that this minor support area would represent about a 50% pullback of the entire run from the prior day. When the breakout run more than doubles the area back to the first support break, it is also time to be thinking that the price pattern is extended.
Also, remember that this high was set right at 10:30 a.m. ET reversal time. This is perhaps the most powerful reversal time and extended runs into this time period often set highs for the day. If you do not believe this, simply look at the market over any several day period. And draw lines at the 10:00 a.m. ET and 10:30 a.m. ET reversal times. The series of events that came together made this an excellent shorting opportunity at the high on the climactic advanced sell set up (CAS), rather than buyable on the pullback as shown in the first chart.