VCM Weekly Trading Lessons
Self Generating Support
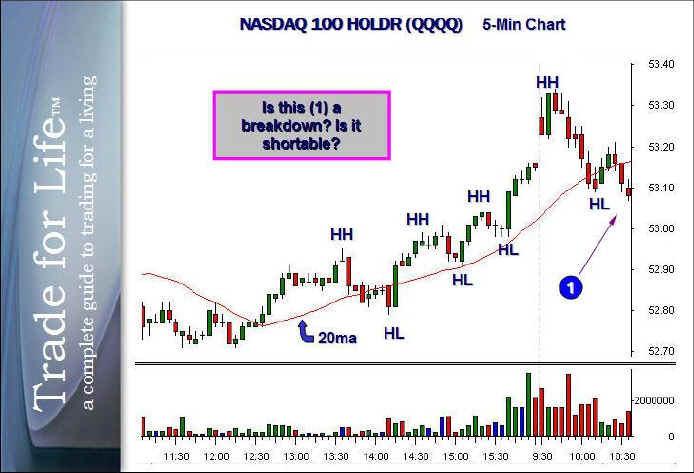
The market gaps up one morning. You notice we were extended from the day before, so you play the market to pull in during the first half hour, and you nail it perfect. You figure that since we are so extended on the daily and hourly charts, that this may be the day for a ‘sell-off’. We fill the gap, into the rising 20 and we begin to bounce. You are looking for a sign of weakness thinking that the market wants to go down more. And you get it. After a small bounce, the market comes back down and trades under the last pivot, making a new low for the day (1). So you go all out short. This happens frequently. How does your short turn out?

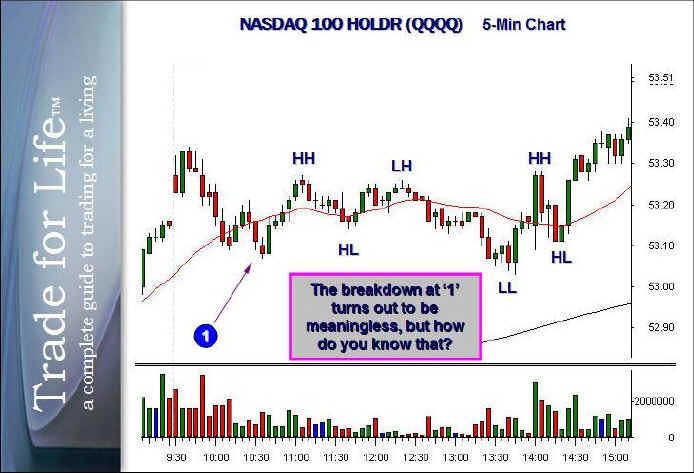
Your short of the market does not turn out so well. If you look at the second chart, below, you will see how the rest of the day played out. The low of the day ‘breakdown’ failed instantly, and then we went sideways and closed higher. Just a ‘fluke’ day, or predictable? Well there are some concepts that can help you get through a day like this. You may be thinking that this is shortable because it is a ‘break of the trend’. After all, if you look at the chart above, you can clearly see that the market traded with higher highs (HH) and higher lows (HL) and respected the 20 period moving average the whole time. Your short at “1” was a break of the trend, right? Well here is rule number one from this lesson. A break of an uptrend is NOT a downtrend. There is a third category called sideways, or sloppy and sideways. Mistake number one was assuming that a downtrend had automatically begun.
Next, concept number two from the chart above. Was there a reason that the market broke that support area and penetrated beneath the low of the day at "1"? The answer is yes. And it is a fairly obvious one that you should recognize immediately in the future. Notice the last rally before a pullback in question began. It is the one that has the highest high on the chart. Notice how far we are extended from the rising 20 period moving average at that time. This was a mini climactic rally. Rule number two is: the first pullback after a climactic rally will often fail the first time.

As you can see, the market just went sideways all day. The range for most of the day was only 25 cents, which is very tight. If you look at the first chart, you will notice there is not really much support beneath the "breakdown" at "1". Does this mean the stock should fall? Well, not necessarily. And now we come to the title of this article. Perhaps you have noticed many times when a very strong stock consolidating sideways, and it seems that it breaks below the consolidation, only to return to the price range without breaking down all. You look all around and based on your understanding of support and resistance, you feel the stock should fall. It is "overbought" as no support to be seen anywhere. However this concept, like many in trading, is very misunderstood.
When very strong stocks (or the market) get truly overbought in a climactic type fashion (which means huge volume come in to create a very large bar at the end of the long run) the price will often retrace quickly because of the vacuum that is created underneath. However when a stock (or the market) grinds its way up in a "stairstep fashion" there is a constant process of profit taking and fresh buyers are entering the scene. In a high demand situation it is possible that when the stock hits its high, it will simply go sideways. There are sufficient buyers that never exasperated themselves that continue to support the stock and force it to go sideways by buying all of the little dips that occur. This allows profit takers to get out without driving the stock price down. Support is constantly generating itself and does not need to rely on prior areas on the chart. This is known as self generating support. How do you recognize it? Like many concepts in trading it is not always easy. The first step is to look at the bigger time frames.
One concept to remember is that a daily chart is not going to break down simply because a five minute chart loses its uptrend. As a matter of fact most any stock will break its five minute uptrend during lunch even if it is one stronger stocks in a market that day. When that happens you back up a look at the 15 minute chart and decide if the overall pattern is one that needs to retrace, or if is one that can continue to find buyers and consolidate sideways through time.

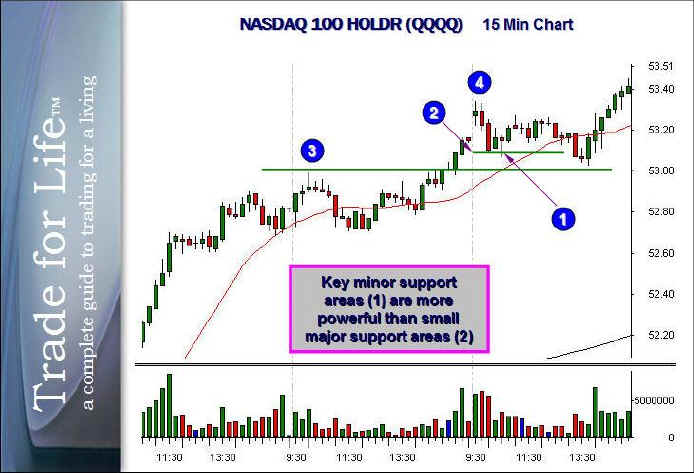
Looking at this time frame many things begin to come to light. Notice how when you back up a timeframe you get to see the forest without staring at each individual tree. This is a practice that should be followed even if you are the most micro of scalpers. Even a one minute trader should understand the general pattern and trends that exist that day based on the 15 minute chart rather than just staring at the one and two minute charts. That would have you avoiding the mistake made in the situation described above. Looking at the 15 minute chart we can see that the concept of shorting at "one" was a flawed idea. The real support level exists at the line drawn at three. This is a minor support line which is the only true support in a trend like this. Because of the overbought condition at the time we got to "4" the market needed to consolidate sideways and eventually reach the support level offered at "3". This generated a new rally in the stock. When the short was being contemplated at "1", it is very obvious in the chart above there was no breakdown whatsoever. As a matter of fact the only reason the price did eventually return to that area was because it was overbought, not weak.
In summary: