VCM Weekly Trading Lessons
Selecting Targets
As new traders, we are all taught golden rules that make up many of the basics of trading. We usually proceed to ignore all those rules until the pain is so great that we reach down deep inside of ourselves to find the ‘real’ answers, the real rules we need to make money. After much hard work, more pain, and what seems like a long wait, traders usually wind up finding their own answers. Those answers always turn out to be exactly and precisely the ‘golden rules’ that were taught on day one. The traders just had to discover for themselves.
This is a fairly basic lesson, especially when compared to some of the recent lessons. Yet it is a topic that comes up often and is at the heart of problems for many traders. One of the biggest issues for traders is maximizing their gains on winning plays. That means getting them as close to target as possible. The first step of that process is to know where that likely target areas are.
First step, is to understand that targets are “areas”. They are not exact numbers, though we may pick exact numbers because we need to select a number at some point. No matter how long you trade, you will never feel good about targets. When you take an easy target, the stock will always go three targets beyond. When you hold on for the bigger target, you wish you would have taken the easier one. At least, so it seems. Such is trading.
Second step is to know that different time frames will have different targets. The scalper will look to small areas of resistance to take all profits. The swing trader may be ignoring the small resistance areas totally because the bigger time frame tells the trader that the stock is going higher. It may stall or retrace at some intraday resistance areas, but it should head higher.
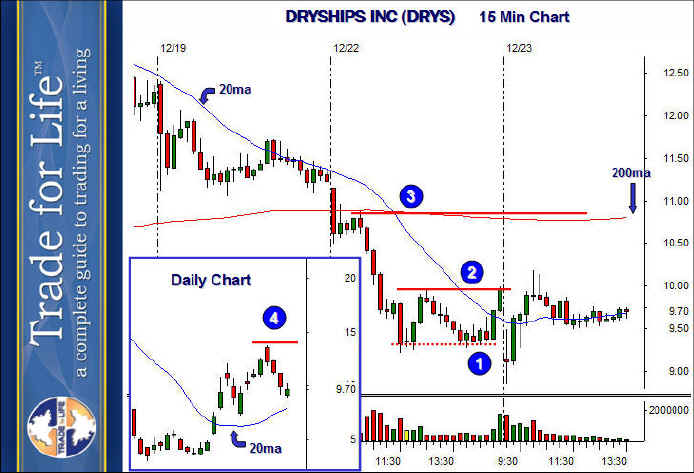
The third step is to know where the strategy dictates the target should be. Most strategies have a defined area that should be used for one or more of the targets. For example, as part of a VCM buy set up strategy, traders should know that one of the targets is the area of the last ‘pivot high’. For example, in the chart below, the daily inset shows a VCM buy set up. On the daily chart, the first target is at ‘4’.

The problem is that many strategies have vague targets. Some are just vague after the first target; some are vague for all targets. They tell the trader to look ‘to the left’ for resistance. This is what we want to do here; to set up some basic areas for intraday resistance. This will not cover every chart, but at least it will give traders an idea of where to look to take some profits on a variety of plays.
Every chart will be different of course, but here are some ‘areas’ to look at. This play was based on a ‘novice’ gap down on the daily chart, into a daily VCM buy set up. We were bullish at open and bought the 2 minute high. How high can it go? First, the area at ‘1’ is the first area of minor resistance and is always an area to deal with. On most charts, the area of minor resistance will be the greatest area of resistance and must always be respected. On this chart, the area of minor resistance came up very quickly. It did offer resistance (just shows as a stopping tail on this 15 minute chart), but this play had some room to run since it originated from the daily chart. Scalpers could look to take some quick profits here, but we felt this target would be over come rather easily. Next, was our first real day trading target at ‘2’. This is the first area of major resistance. This is due to the two similar prior highs in the 10.00 area. Note, that getting above this area actually changes the trend on this fifteen minute chart. That is reason to take some off the table here. Trend changes are not easy, so taking some off even if the trend change fails will guarantee some profits even if this trade proves to be weak. You see that this target was met, but serious double topping tails (TTs) formed at the target area.
Notice, above ‘2’, we have a void all the way up to ‘3’, which is the next ‘pivot’ from the prior downtrend. Every pivot encountered is a potential area of selling. Note this one is doubly strong, because we have the 200 period moving average lining up perfectly with price resistance. Moving averages are not actual price resistance, but they can act as resistance. Depending on where price resistance is, and the extension of the stock, prices will sometimes react severely into moving average areas. Note that the fist morning rally that formed a topping tail into minor resistance was also encountering the declining 20 period moving average for the first time.
Beyond three, we can see other prior pivots in the downtrend that will all be areas to watch. The area at ‘3’ is likely a very strong move for an day trading target (that is a large move for one day) and after that, the target as a swing trade would come off the daily chart, as we discussed at the beginning of this article. The prior pivot high (4) is another target area, based on being the prior pivot high on the daily chart. This target is only available because this daily chart is set up as a swing trade. If the daily chart were not a set up, we would only look at the intraday chart to the extent we had an intraday strategy to play out for intraday targets.