VCM Weekly Trading Lessons
Secondary Entries, Part 2 of 2
There are many times when using more than one time frame can be a big advantage. We have looked at this concept in prior issues when confirming a strategy, to see multiple time frames confirming a direction or a pattern. Today and next week we want to look at two ways in which using two different time frames to find the entry can be very useful. Last week we looked at waiting past the entry on the big time frame to get a ‘second sign of strength’ on the smaller time frame to confirm the entry. That was because a very nice 15 minute buy set up would have stopped out on the 15 minute chart, then ran to its target. Today we will look at a 15 minute chart that does not have a nice set up, but can be played once the smaller time frame confirms the play.
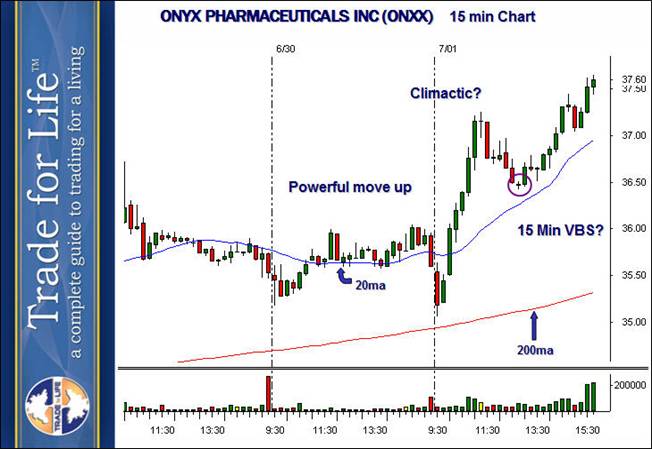
Take a look at the 15 minute chart that formed on ONYX PHARMACEUTICALS INC (ONXX).

Here is the dilemma. We have a very powerful move up in the morning. We break all resistance, and then the pullback begins as we come into lunch. We know we want to use a VCM buy set up (VBS) to buy this stock on a pullback, but the question is ‘when?’ Looking at the chart after the fact, it looks like an easy entry. But in fact, it is not. Take a close look. First, the reason that the chart is labeled ’15 Min VBS?’ with a question mark is because a buy set up never actually forms. Notice we never get three red bars in a row, we never have three lower highs. And even if we did, it appears the stock was climactic on the last rally, which will make this play lower odds. The ‘entry’ bar (‘entry’ is in quotes because if there is no strategy, there is no entry) is a very narrow range bar. That is usually a good thing, but if this is a questionable play; that narrow bar usually just guarantees a quick stop out. It turns out that the narrow range bar (circled) DID hold, but at the time of entry this play looks low odds. Also note that we are still a good distance above the 20 period moving average, and this is happening right in the middle of the lunch-time doldrums. This play, although it worked, was such low quality it should be passed. Yet, we still want an entry as this is a strong stock What do we do? Enter the five minute chart.

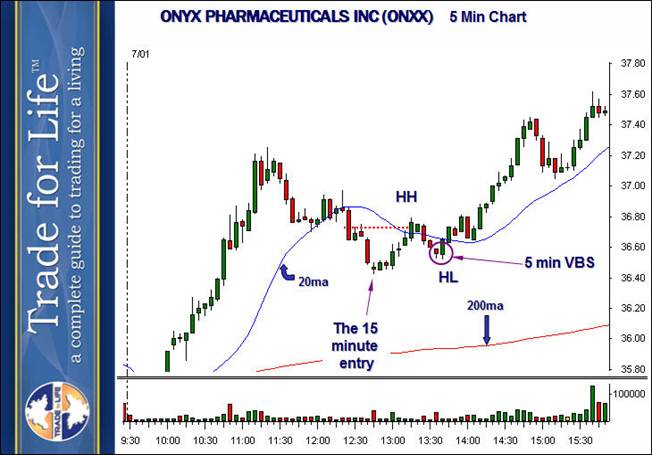
Here we can see where the 15 minute VBS ‘would’ have hit if we played it. But again, we are going to pass. This is because this was a low odds play, so we want to avoid the stop out. AND, more importantly, if the play does work, we do not have to miss it; we just take a secondary entry. It turns out that a very nice bounce occurred, regardless of whether the play was valid. Nice enough we that wish we were in it because it WAS a good play. But there is no need to worry. We simply play the new trend on the five minute chart. We can play as aggressively as we want, because we are operating inside of what is now a valid 15 minute VBS. So we see the rally trade above the prior high (red dotted line) and make a higher high (HH). We now know we want to buy the next ‘higher low’ (HL) using a 5 minute VBS. That is what happens, and the stop is just as small as the one we passed, and we still capture almost all the move.