VCM Weekly Trading Lessons
Reversal Patterns
Playing reversal patterns can mean many different things to different traders. The very term ‘reversal’ tells us two things. First, it implies a change of direction, so we should look at this topic with squinted eyes. We know the odds are always with following the trend, and playing in the same direction of the color of the daily bar. Second, we know that most new traders want in, even though they should not. New traders like reversals, because there is a certain sense of ‘heroics’, finding the top or bottom. But the truth is, it is usually a loser’s trade.
However, knowing reversals is still important, even if it is to know when NOT to take a trade, or when to lock profits in on a good trade. Sometimes, we may want to play a ‘reversal’ as an entry. They can happen in almost an infinite number of ways. Most of these are not recognizable, therefore, not playable. The truth is that most of the time, when a stock DOES change direction, it does so for no apparent reason. However, sometimes, that change happens in a way, and in an area, that we can notice the change as ‘soon as it happens’. Sometimes, the reversal is ‘climactic’. Both of these have been topics of prior lessons. There are also other ways, such as ‘shock value’ that can happen on a gap, or by a failure. Today, we want to look at an example of a ‘failed breakdown’.
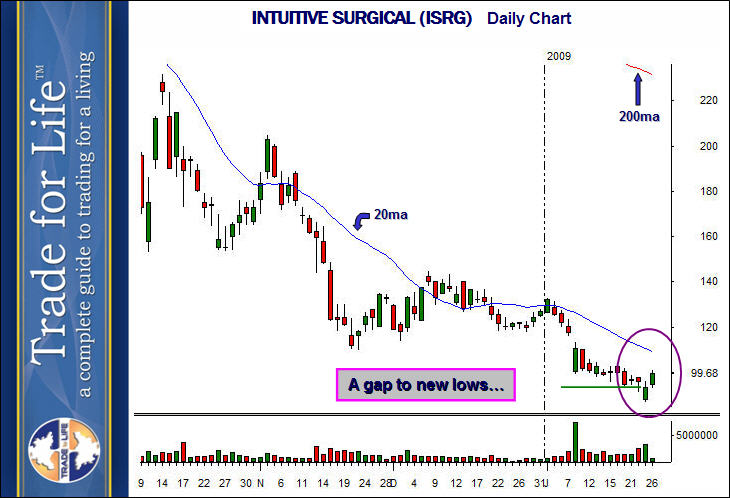
Below is the daily chart of INTUITIVE SURGICAL (ISRG).

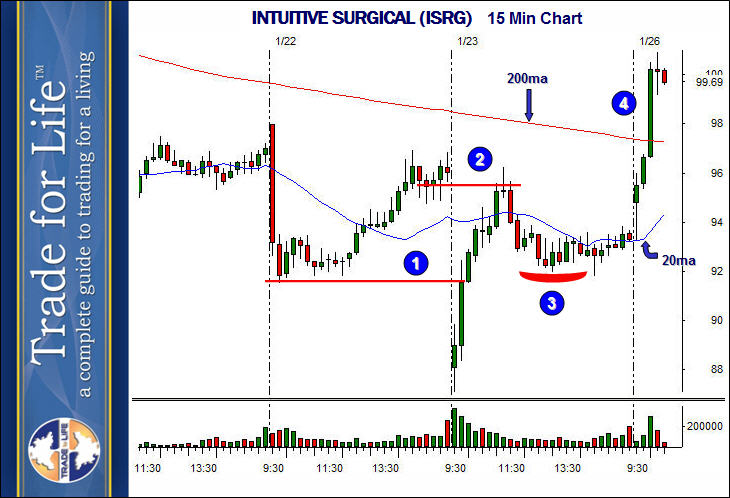
We are concerned with the circled area, which shows the last two days. On the second to last day, the stock gapped to a new low on the daily chart, under a two week long consolidation. By all measurements, this was a bearish gap down. This is a gap down that should have sent the stock lower. However, for whatever reason, the stock decided it had been down enough in the past. It found no more sellers, and found only buyers. This is a case where the stock just ‘screams’ that it is doing a trend reversal. It is a bearish daily, and a gap down gets bought. It keeps going up. So we know the trend is reversing, but when do we know that, and how do we play it? Below is the fifteen minute chart, that shows the day the stock gapped down.

We get odds in our favor by knowing what stocks normally do in this case. Often times, a stock gaps down and then rallies. The question is, how far and how long does it hold? Note the rally on the way up. The area at ‘1’ is a serious resistance area, that should have at least stalled, if not halted the rally, if this stock was EVER going to get bearish. That was clue one. Clue number two, we have a total gap fill, of a large gap, to ‘2’. The bearish gap is erased.
Finally, the total pullback from this rally was graceful, and stayed in the upper third of the morning rally. There is only one direction for this stock to go. It has proven it cannot go lower, even though the trend has been down. The area at ‘3’ actually forms a nice buy setup on higher time frames, or can be played as a base breakout on this time frame. The stock eventually rallied 16 points over the next eight trading days.
As a side note, naturally it would be nice to buy the gap down. This can be done only if the gap down was clear to be a ‘novice gap’ at open. It was not. That is why this move was ‘shocking’ and changed the trend.