VCM Weekly Trading Lessons
Resistance is Only Half the Story, Part 2 of 2
A stock is cruising along, possibly in a nice five or two minute uptrend. You see some resistance off to the left, and wonder if you should get out in that area, or if you should hold off buying the next pullback. Will the resistance end this move, or not? You notice that sometimes the stock may stall a short time, then bust right through, as if the resistance was not even there. The next time the stock dies, never to recover. Is there a way to tell in advance? Why the huge difference in reactions to what looks like the same resistance area?
Last week, we looked at a stock that was in a nice two minute uptrend, then hit resistance, but quickly carried higher. We discussed the reasons why that stock was expected to go higher. This week, we are going to look at a similar uptrend that hit resistance, but brings an end of the move. We will discuss why, and you will see, by comparison, that the key things to look at differed. Be sure to look at last week’s lesson and this week’s lesson together.
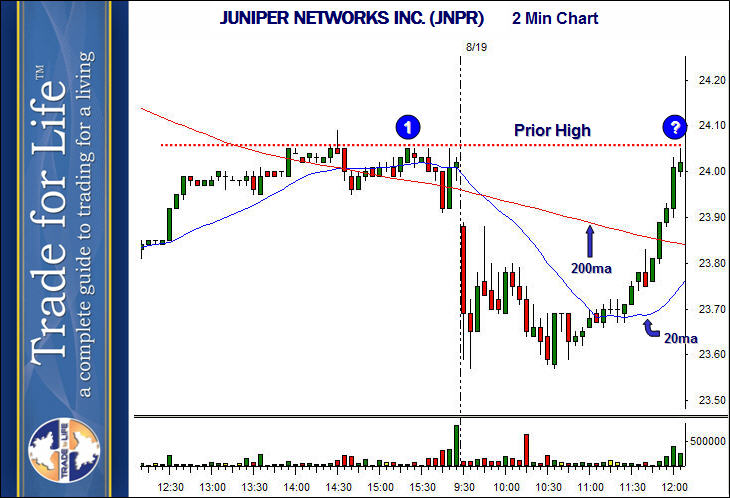
Below is a two minute chart of JUNIPER NETWORKS INC. (JNPR).

On 8/19/09, this stock had a very nice strong move up from about 11:00 until 12:00. Once the stock broke the 23.70 resistance and climbed over the 20ma, it was gone. The rally was perfect, and naturally it stalled at the prior high, at the “?”. Last week, we saw a similar pattern continue higher almost immediately. What about this pattern? Is it the same? Take a look at what happened, below.

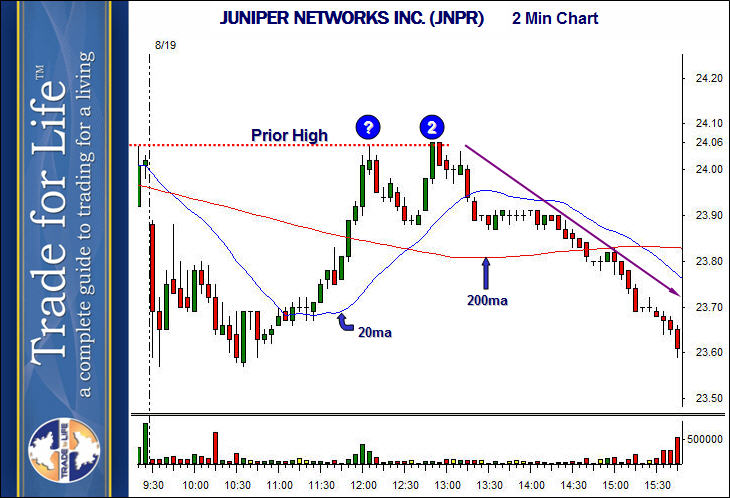
The next attempt stalled at the high again, at ‘2’, and then totally collapsed. Why didn’t this go higher? Let’s look at the same issues we looked at last week.
First, look at the type of prior high that was set. Go back to the first chart. Note the area of the prior high at ‘1’ (on the first chart). Last week this was what we called a ‘simple pivot’, which was just a single bar high. Note that this is a base. Many bars formed this prior high. This is always more difficult to trade above.
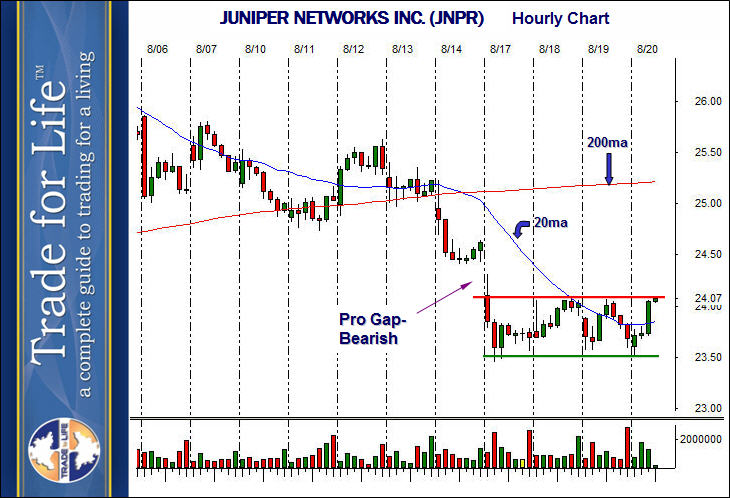
The second thing to look for, and usually the more important one, is the bigger picture. Look what was happening on the hourly chart of JNPR at this time.

This rally on the two minute chart is the high on the 19th. Note that the hourly chart is in a downtrend. It also had a bearish professional gap, and has been sideways ever since. Shorting the high of the day on the 19th, on the hourly VCM sell setup, is a great play. You would be shorting the top of a bearish base. Now go back to the two minute chart. Do you really want to be buying that pullback?
Compare this lesson with last weeks. Hopefully this will go a long way in understanding how support and resistance really works.