VCM Weekly Trading Lessons
Relative Strength and Timing
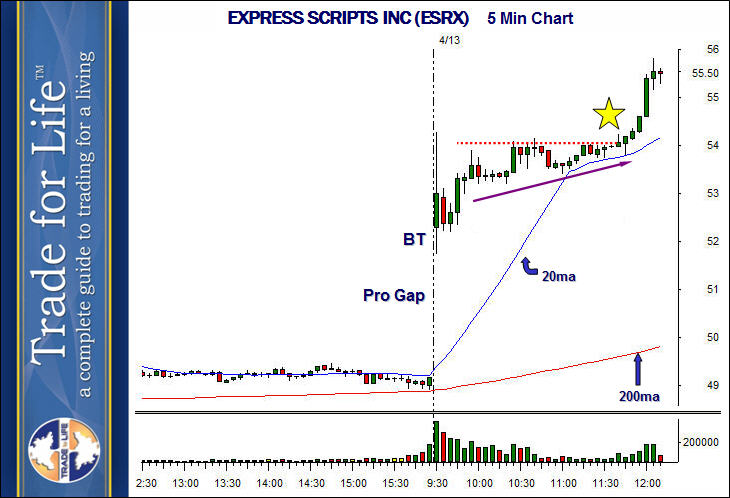
It is our job as traders to look for charts that meet our requirements for strategies we want to trade. We look for the best strategies, and then follow our plan on how to enter and how to manage. We want to show you the concept of relative strength and timing. This concept can be used to enhance any strategy you currently do, or can almost be used as a strategy all unto itself. Below is the five minute chart of the stock, EXPRESS SCRIPTS INC (ESRX),

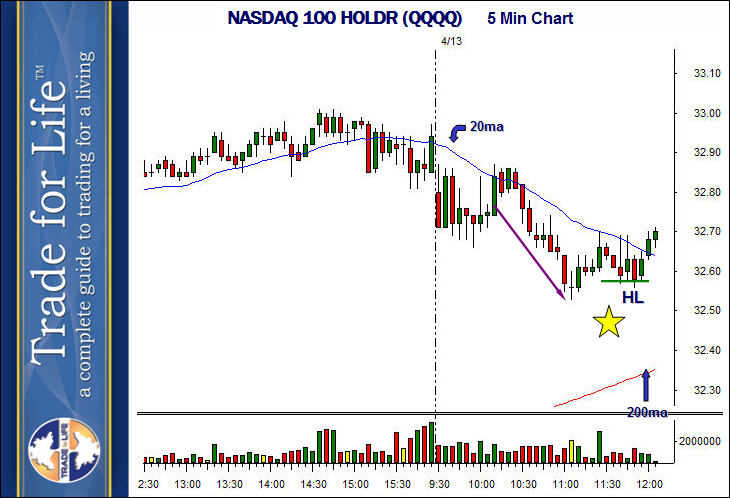
These are snapshot pictures, above is the stock, and below is the "market" (the NASDAQ 100 HOLDR, QQQQ), taken at the same time, on the same day. View and compare the two above and below each other. By the way, it makes sense to set up your trading page so you have this vertical alignment also.

We are focused at the area of the yellow star. When we talk about "relative strength", we are not talking about the technical indicator by that name, nor are we talking about whether your uncle can lift a sofa over his head. We are simply looking at the strength of one stock compared to either; 1) another similar stock, 2) the sector it is in, 3) the market itself. Most of the time we are comparing the stock to the market.
We use a visual comparison of the two charts. This comparison can be aided by lining them up vertically, and by using moving averages and trend lines as guides. Notice the following differences:
Note, that there is an exception to playing a relative strength play like this. We do not want to go long if the market is "free falling", on bigger time frames. If you look back on your own charts, you will see that at this time the QQQQ was in a very bullish uptrend. This was just a morning pullback.
Note also, the "timing" of the play and entry. The solid green line on the QQQQ chart, just above the yellow star. This was the first "higher pivot low" (HL) that formed, which broke the intraday downtrend. This slight showing of bullishness was all ESRX needed to pop between 11:30 and 12:00.
The plays are easy to find. If in a bullish market, wait for a morning when the market is pulling back, preferably to an hourly support level. Scan (our traders use the VCM Scanner Pro™), to find stocks near the high of the day, or in the upper 10% of the days range. Then sort through these to find the ones that are basing, not running on extended moves. Naturally, the reverse can be applied in a bearish market.