Weekly Trading Lessons
The RBI Examined
If you are not a Team Trading Prop Trader, and just finished watching the Yankees dominate, you may think this is a talk about baseball. It, however, is not. The RBI stands for ‘red bar ignored’, and its counterpart is the GBI, the ‘green bar ignored’. While we will be discussing by example the ‘RBI’, all of these concepts apply, in a reverse manner, to the ‘GBI’. While this can be a great strategy, many ignore all of the elements that are needed, which leads to taking bad trades. Let’s take a look at the proper and not proper ways to play the RBI.
The RBI can be thought of as the ‘oops, I missed it’, play. It happens when a very strong move occurs, that you see early on, but you didn’t get the breakout. Sometimes you get a pullback and can play the VCM buy setup. As you may have discovered however, the really strong ones just stall momentarily, then take off again. This is where the RBI play comes in, as we teach in our two day course. While we cannot go over all of the elements of this strategy, there is one critical part of the set up that many miss. That is what this lesson is for.
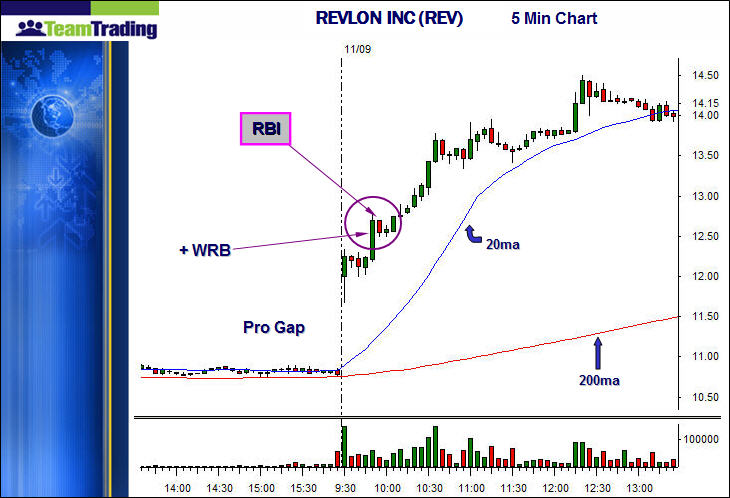
Below is a five minute chart of REVLON INC (REV). On the day we are focused on, the stock gapped up at open, and assume for this discussion it was a professional gap (bullish, in this case).

The stock consolidated for the first four bars of the day, then broke out, and a bullish wide range bar (+WRB) followed. If you took the breakout, you are all set. However, if not, how do you enter? This stock was too strong and fast to form a buy setup. The focus is on the red bar that follows. When it becomes negated, or ignored, there are good odds the stock is going higher. The chart above is a good example, because the +WRB bar is occurring on a new break out of a bullish pattern.
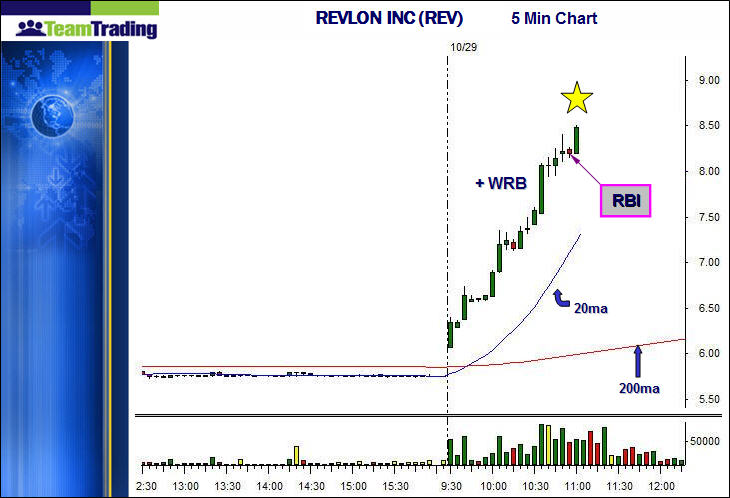
Let’s compare that to another chart. This chart is one that many traders mistakenly play.

If you notice, here we have another bullish wide range bar (+WRB), with a red bar following. The next bar trades over the red bar (and the prior topping tail). Bullish?
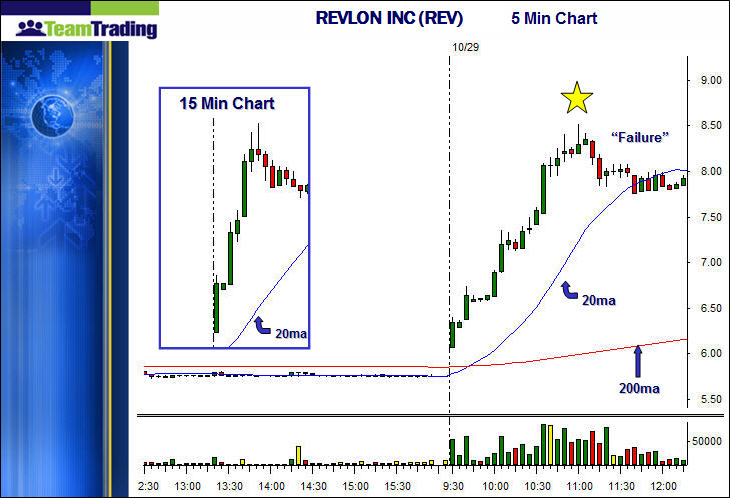
This is not a playable setup. The +WRB is not a new breakout bar. As a matter of fact, after an extended move, a +WRB is a sign of the trend ending. Therefore, the RBI is a low odds long, due to the extension of the move. Also, the size of the red bar presents a catch-22. The smaller the bar, the smaller the stop, but the less reliable the play is, as the bulls are overcoming little resistance to justify the play. Take a look how things played out, and another clue you want to look at.

Note, the yellow star is at the same exact spot on both of the last charts. Notice that what was a big green bar, became a big topping tail, after this ‘play’ would have triggered. The stock never rallied again that day. Note the clue. Always check the next higher time frame. Notice the 15 minute chart, inset. The vertical rise, on five bars, well extended above the 20ma helps confirm that this advance leading to the RBI on the five minute chart is too extended to be bullish.