VCM Weekly Trading Lessons
Power Trend Versus Climactic
One of the concepts we teach at VCM is to stay with the power of the trend. This means following the color of the daily bar, and following the intraday trend as it forms, using pivots and the moving averages. There is only one strategy we teach that ‘fights’ the trend, and it is the climactic play. While we teach it, we instruct that it should be ‘rarely’ used, and only by seasoned traders. New traders should avoid the trades all together, as it is clear that most newbie traders do not recognize the pattern. As a matter of fact, almost every play that looks like a climactic, should be played in the current direction. If traders did this, they would do very well.
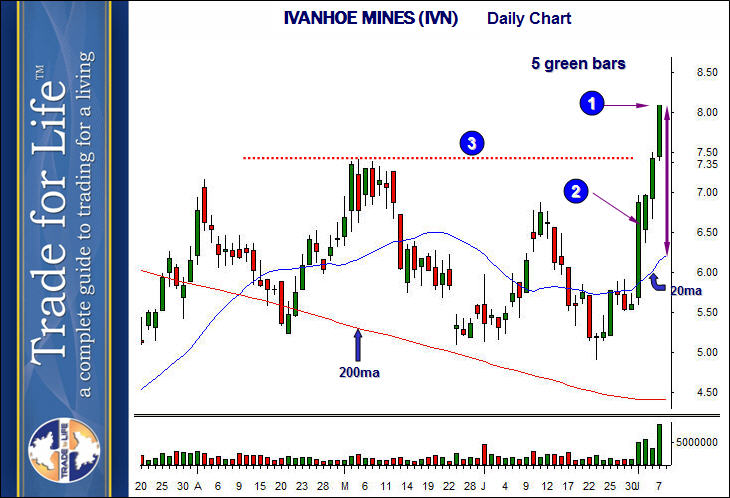
As an example, let’s look at the daily chart of IVANHOE MINES (IVN).

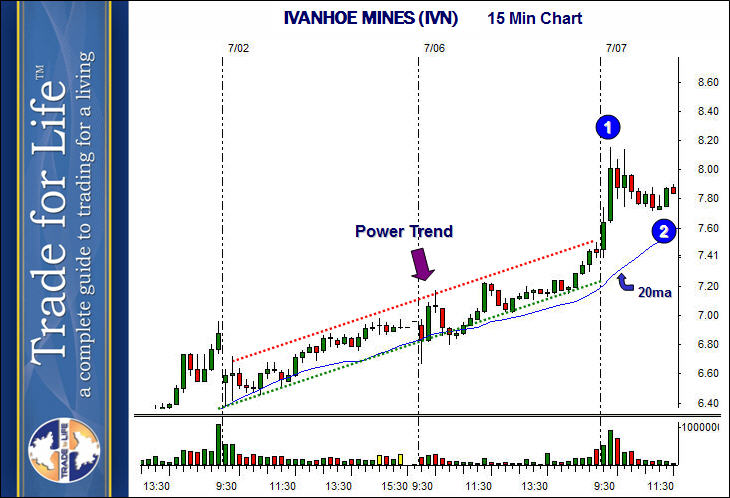
This is the type of pattern many new traders will look at and assume that this is a climactic advance sell. This is how the above chart looked during lunch, at ‘1’. There ‘are’ five up bars, and it ‘is’ extended from the 20 period moving average. However, not all plays are the same quality. Here are some issues from this chart. First, the third green bar up was a gap down that then rallied (2). This takes away from the quality of shorting in the near future. Second, the last bar, the fifth bar, is actually a ‘break out bar’. See how there is resistance from prior highs at the 7.50 area (3)? It is not until the last day that the stock has the strength to break above this area. That is not ‘good’ for those who want to short. Finally, let’s look at the most important thing. Let’s see how those daily bars formed. Let’s look inside the daily chart, at the 15 minute chart, for the three days leading up to this pattern.

The key here is the two-day power trend. Notice that for all but the last day of the five days up, IVN was going at a very sustainable, almost ‘slow’ rising uptrend on the intraday charts. It was a tight power trend, hugging the 20 period moving average. These types of moves are simply strong trends, not climactic plays that are likely to reverse. It is not until the last day, that a strong intraday move comes, and pulls the stock away form the moving average, at ‘1’, above. This is why the stock stalled and pulled back. While the move to ‘1’ could have been shorted as a climactic advance sell, it had a limited target for the reason mentioned.
As a rule, we also do not ‘buy’ the first pullback from a climactic advance sell. However, since this one was questionable, and only had one sustained rally, this pullback was played long on this day in the VCM Proprietary Trading Room. This was played as a 15 minute VCM buy setup. The key is to know, that the pullback may be sloppy in finding a bottom, and may take a while to form. However, when the strength of the stock returns, it is often better to be ‘long the pullback’, and with the trend, then trying to find the top, for small gains.
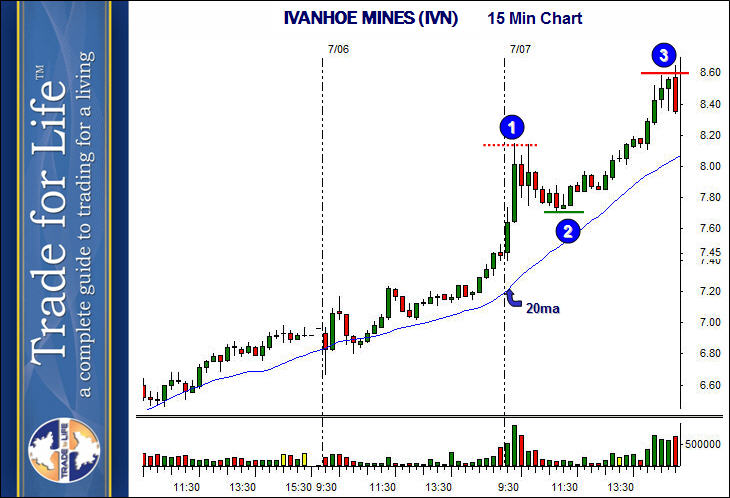
Below is how the stock fared.

While the move from ‘1’ to ‘2’ may have made some money, it was a tough play and look at the topping tail and volatility when the play started. On the other hand, look at the move from ‘2’ to ‘3’. Easy as can be. Study charts like this, get to know the plays YOU want to do; get to know them intimately.