VCM Weekly Trading Lessons
Intraday Gap Play
Without a doubt some of the most intriguing and popular plays for traders are the opening gap plays. This is likely due to the fact that the gap plays are often moving fast the first 30 minutes and a great amount of money can be made or lost in a short period of time. There also seems to be some “fascination” about understanding gaps and how they will likely behave. We have already presented a couple of articles about gaps and understanding the bullishness or bearishness as it unfolds on the daily chart. Today we want to take a look at coordinating the daily bias with the intraday chart pattern.
Let’s take the most extreme case. Let’s say you have a gapping stock and on the daily chart it is a ‘perfect’ play to you. It is as bullish as it get. It such a case, you are going to rely on the daily chart to the greatest extent, and may only use the intraday chart to find the entry to a very small extent. For example, your entry strategy may be to use a five minute high, or a two minute high (or even a one minute or 30-second high?) as your entry point.
Now let’s take the other extreme. A gap on the daily that is totally neutral to you. We now need to give very little weight to the daily chart, and total emphasis to the intraday chart. As a matter of fact, it may not even be on your play list if the daily chart gives you no clue at all. To the extent you look at playing it, you will need to find an intraday pattern to play. So we will have to wait until an intraday uptrend develops and play a quality buy set up on a 15, 5, or 2 minute chart.
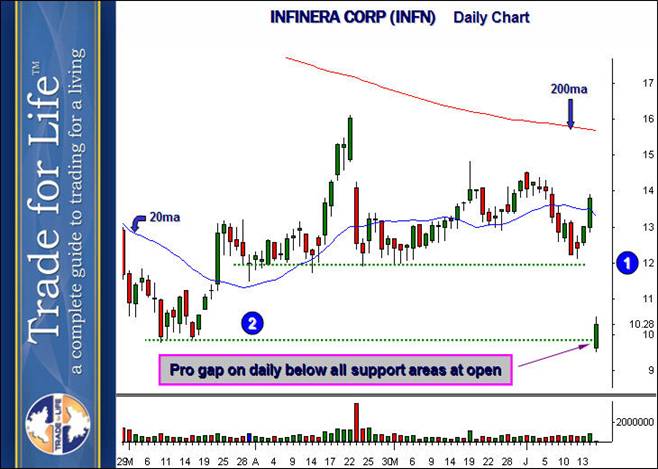
Now in between there can be some coordination. You may have a daily chart that says ‘bearish’, but not a perfect set up. So you are not willing to play a ‘one minute low’ as your entry. In cases like this, we look to find a set up that will compliment or confirm our daily bias. Let’s look at a trade done in the VCM Proprietary Trading Room as an example. The stock is INFINERA CORP (INFN), and the play was on the professional gap down shown in the daily chart below.

The stock gapped down well under ten dollars (the bottom of the green was the opening price, and all we knew at open, so ignore the green bar). This was a professional gap down under all support levels. Both the level at ‘1’, and even under ‘2’. If there was an issue with the trade it was that the gap was much larger than we needed to see to be bearish. At some point that works against the trade. So we wanted to see an ‘intraday entry’ that would be a bearish set up. Below is the two minute chart.

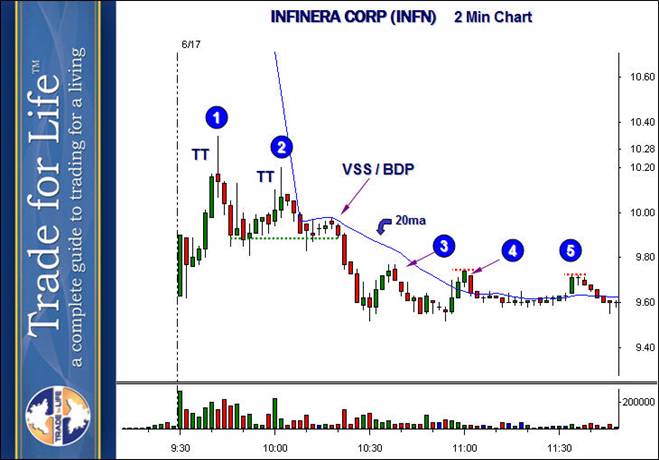
Playing this way proves to be very helpful. As you can see, the stock had quite a rally at the open. This can happen because your daily bias was wrong on the play, or it can just be the case that the stock will rally before selling off. Naturally any attempt to short before hitting ‘1’ would have not worked. But that is why we bring in the intraday chart, there is no reason to short before ‘1’.
Now, many of you may look at this and think the play was to short at ‘1’ where that big topping tail (TT) formed. This is not the case however. After the fact, it turns out to be the best entry, but at the time, how do you know the stock won’t pause and go higher? Remember our goal was to find a short set up intraday, and that rally was bullish. On the intraday chart it was in an uptrend. The only time you can short that rally is if you were VERY bearish from the daily chart, so much so you were willing to assume that any buying would be sold into. So we wait.
The stock drops to the opening price, and then rallies. That rally again ends in a big topping tail, and makes a lower high at ‘2’. Here we have the first indication that the intraday pattern is turning bearish. Aggressive traders ‘could’ short here. Remember, we want a bearish set up, but it doesn’t have to be perfect in terms of the trend because we are pulling our bias from the gap on the daily chart. The only problem is that the stop is going to be large on that entry. So we wait. Shortly after that, a small bounce produces a VCM sell set up (VSS) that after it triggers also creates a VCM break down play (BDP). That was the best entry, which also yielded a nice reward to risk. As the stock drops and hits bottom a bottoming tail forms, which is time to take half profits. As the morning progresses, ‘3’, ‘4’, and ‘5’ are lower highs to which the stop can be lowered.
Eventually this stock rebounded to the high of the day (hence the green bar on the daily chart) but not before delivering nice profits. Since the back half was being trail-stopped, it also had nice profits, and gave the ability to take the stock much lower if it chose to go lower.