VCM Weekly Trading Lessons
Increase Your Odds Part 2 of 5 – Relative Strength
Over these five lessons, we are going to give you five important, yet very simple concepts that should be a part of every trade you do. These are some of the very things we train our VCM traders to do, to increase the odds of every trade being successful…
The concept of relative strength is one that most traders are aware of to some degree. This discussion is NOT about the technical indicator that some use which is called the ‘relative strength’ indicator. This is about the visual comparison of one stock to another, or more commonly, one stock to the market. This concept is actually both ‘relative strength’ and ‘relative weakness’. The concepts are identical, one is bullish, and one is bearish. For simplicity, we will continue to discuss relative strength, but understand that everything can be reversed to discuss relative weakness.
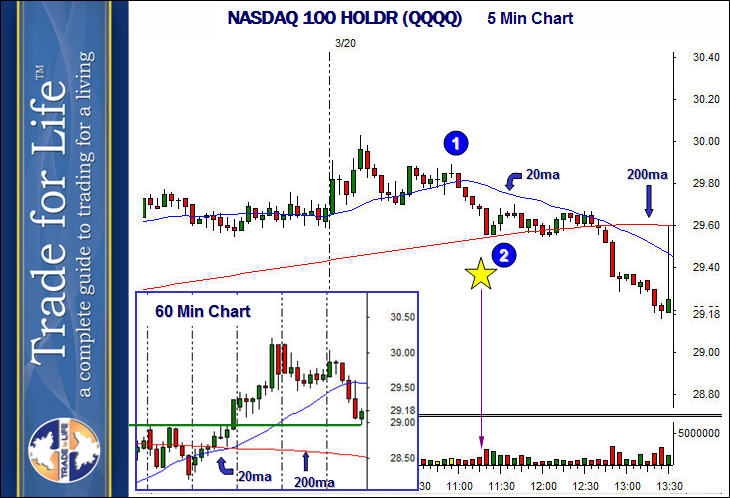
Let us begin by reviewing a recent trading day. We will look at the ‘market’ through the eyes of the NASDAQ 100 tracking stock, the QQQQ.

There are a couple of important things to note, in order to maximize the concept of relative strength. First of all, notice that the five minute chart of the market is unquestionably in a downtrend at the time at issue, marked with the yellow ‘star’ at 11:15. Note also, that we actually have a wide range red bar forming, into the 200 period moving average. Now, also notice, that the hourly chart (inset), is NOT in a freefall. As a matter of fact, it has been in an uptrend. It has just broken that uptrend, but is coming into a support area (solid green line). Things are bearish, but not ‘freefall’ bearish. They are just bearish for a half day or day. The bulls are still in town, they are just taking the morning off.
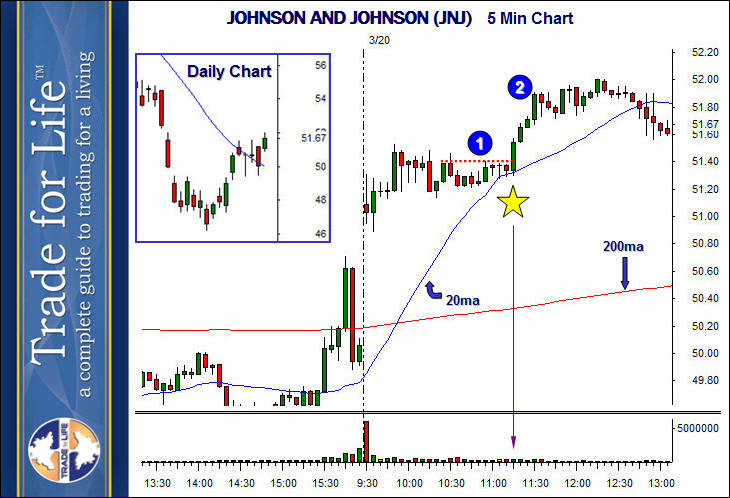
Now, let us take a look at the stock we are going to discuss. It is not hard to find stocks like this, because it will show up on a ‘high of the day’ scan. This is one of the common scans that can be found on our VCM Scanner Pro™. This is the five minute chart of Johnson and Johnson (JNJ).

Compare the price movement between 11:00 and 11:30 in both JNJ and the QQQQ. While both were holding bullishly at 11:00, the QQQQ began a rapid decline that hit some support. The JNJ held during the first half of the QQQQ decline, and actually rallied during the second half.
Notice that the stock has a very bullish pattern, regardless of any concept of relative strength. It gapped up, refused to fill the gap, and consolidated sideways. It set up a very tight base, and continued consolidating into the rising 20 period moving average. It broke out right at 11:15 reversal time. This is a perfect example of using relative strength to increase the odds on an already bullish pattern.
Remember the highlights.