VCM Weekly Trading Lessons
Gaps That Fill and Hold
We teach many gap strategies that are very effective. However, they require very specific criteria to have viable odds to play a gap shortly after it gaps open that morning. Most gaps are just ‘meaningless’, meaning we really do not know where they will go after the gap. Today’s lesson is not really about a ‘gap strategy’. It is about what you might see the day after a gap. A gap you may have had no interest in – until now.
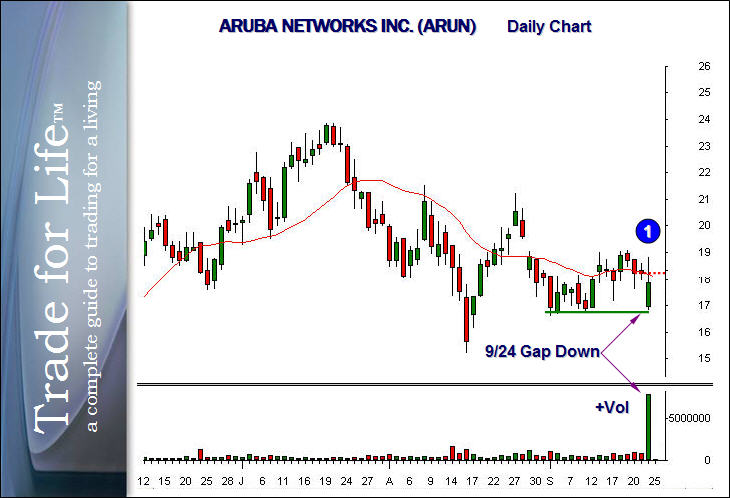
Below is a daily chart of Aruba Networks Inc. (ARUN).

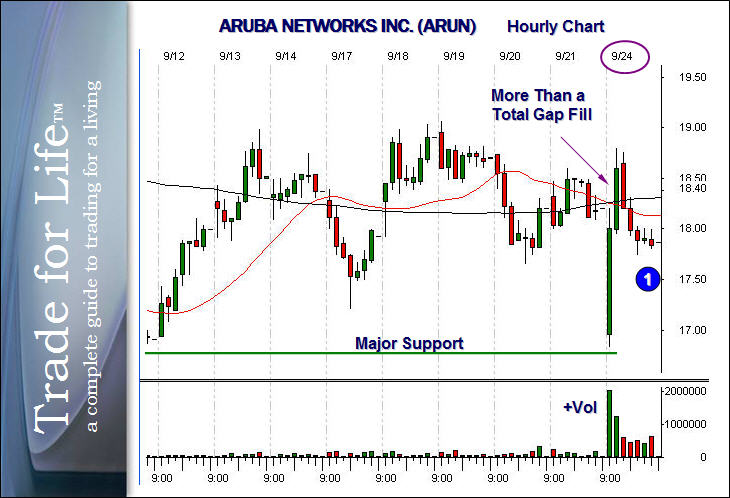
If you are thinking that this gap down was nothing special at the time it happened, you are correct. Yes it did gap down to some support, but it was not the type of gap that meets the requirement to play long. This is not being shown as a suggestion of how to play a gap long. It is a matter of fact the stock went quite unnoticed the morning that it gapped. However, it was not hard to find the stock that night or during the day on intraday scans. The reason was because of the volume. If you sorted your watch list by volume increase on a particular day, this stock would show up all day long and that night as you are scanning the daily charts. This is when the stock got interesting. While it was not necessarily a play to buy the stock at the open on this day, the strong rally on huge volume made the next pullback buyable. The stock continued to rally not only until the gap was filled at the red dotted line in the chart above, it rallied all the way to the prior highs at "1". While that ‘topping tail’ at “1” looks bearish, that is not always the case. Often times a topping tail on the daily chart is nothing more than an hourly buy set up. Here is how the hourly chart looked at the end of the 24th.

This sudden movement and pullback was not enough to keep the price above the 20 period moving average. However it did form a nice controlled pullback with less than a 50% retracement as it came into the area marked at "1". This left a nice buyable pattern on the hourly chart going into the 25th. The pattern you see on the chart above is a very bullish pattern. It is a price pattern you should take note of and memorize; a stock that gaps down and recovers 150% on huge volume. This stock is going higher. However, the next morning, the stock did not open as we planned.

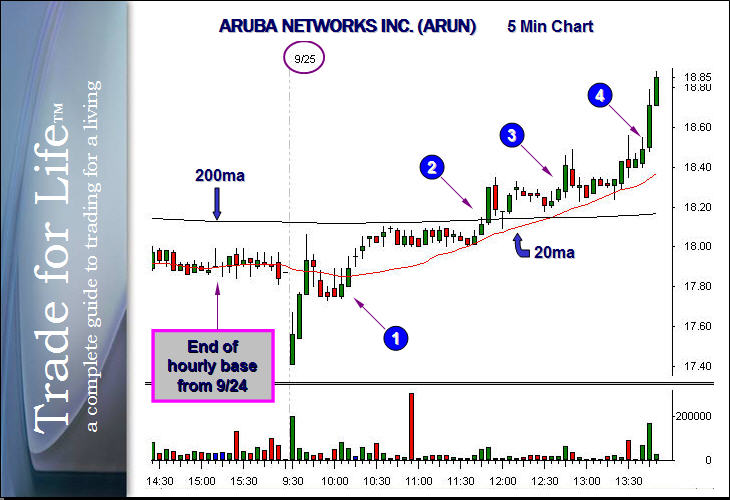
The next morning the stock gapped down again. It likely did so partly because the entire market was gapping down. The pattern you see is a very common sight for a stock that has already proven that it has buyers below it. The stock immediately ran to fill the gap, and once again went well beyond the gap fill. That pullback was very buyable as it was a very shallow pullback that consolidated briefly through the 10 o'clock reversal time, at “1”. From there you can see three more entries later that day on the five minute time frame. There are countless more on smaller time frames. The point of this is when you find a stock that performs as the stock did on the 24th, you know that it has buyers and will continue to form a very bullish pattern. The stock becomes buyable every pullback and will usually perform whether the market is cooperating or not. The concept comes from a stock that can fill the gap, and yet stay strong rather than retreat. Remember these patterns; while they do not occur often, they're very powerful when they do.