VCM Weekly Trading Lessons
Buying a Downtrend?
The concepts we teach at Velez Capital Management (VCM) are very precise and very far-reaching. There is information imbedded in the teaching that does not present itself to most students until they are ready to receive it. This often takes some time and experience. During this learning period there will be times when students go through great revelations and doors open. There will often be times that students get frustrated as nothing seems to make sense anymore. This is all part of the process of becoming a master. Not just in trading, but in anything.
One of the more common ways we see this exhibited is when new students look at a trade being done in the lab, or in one of our trading rooms and proclaim, “That is not a VCM strategy, that is not what I was taught!” However, it almost always turns out to be the case that the trader who is instructing or showing their current trade actually is very much using the VCM approach. After time, sometimes good traders combine methods and personalize things, making it more difficult for the student to see the basics they were taught. Sometimes the student is just not understanding the concepts they were taught. There are countless examples of this. Let us take a look at one of the examples of a very basic concept that eludes not only new traders, but even more experienced ones.
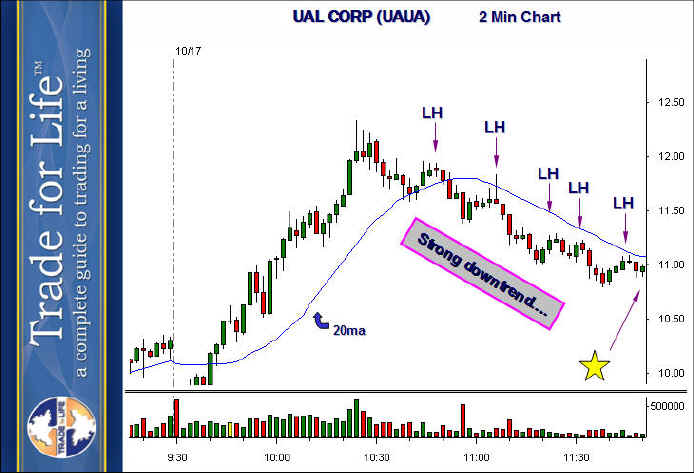
Below is a two minute chart of UAL Corp. (UAUA). Once the stock rolled over just after 10:30, a nice downtrend developed. We had a series of lower highs (LH) all under a nicely declining 20 period moving average. A perfect downtrend.

So right about at the ‘star’, the call comes for the next play on UAUA. The play is a ‘long’. Enter over 11.23 stop under 10.80. Buy? how can that be?! This is NOT what VCM teaches, we cannot go long, we are in a downtrend.
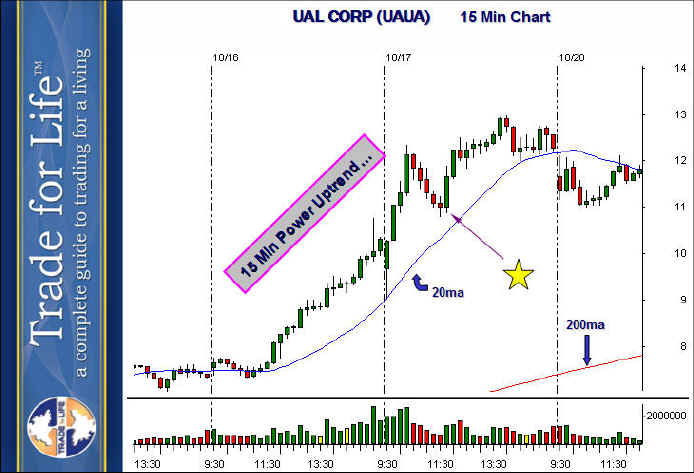
Well, the problem is that a trader looking through the eyes of only one time frame is always handicapped to some extent. At VCM we always look at any chart through the eyes of at least three time frames. Take a look at the chart below. It is the same stock, the same day, and the yellow ‘star’ represents the same moment in time as shown on the chart above.

The only difference is that this is the 15 minute chart. The play shown above is a 15 minute VCM buy set up, happening in a nice power uptrend, just above the rising 20 period moving average. The very buyable pullback leading into that set up was a nice steady five red bar drop. This drop of five red bars on the fifteen minute chart was one hour and fifteen minutes of downtrend for the two minute chart. But look at the nice set up it creates. A two minute downtrend into a fifteen minute buy set up. Who wins? The fifteen minute chart, of course. The bigger time frame always wins. When the fifteen minute chart wins, the two minute downtrend will fail by definition. Some traders even use the failure of the smaller timeframe to confirm the set up of the bigger timeframe. Now that almost sounds like a strategy.
Here is a statement that needs to be said. It may help some traders, as it almost seems to be forbidden to say. Any time you play a buy set up on a particular timeframe, you will ALWAYS be playing against the trend of the smaller timeframe. It happens every time, by definition. To play the daily buy set up, you will be playing into an hourly downtrend and a fifteen minute downtrend. To play a fifteen minute buy set up, you will be playing into a five minute downtrend and a two minute downtrend. It is always the case.