VCM Weekly Trading Lessons
Another Target Area
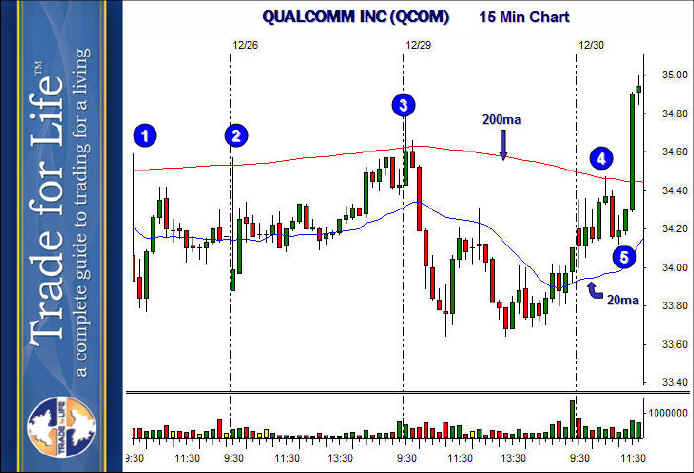
We had many positive comments after last week’s lesson regarding some basics on target setting. So we are going to look at another interesting concept that is shown on the chart below. Yes, we picked this chart to make this point, but if you look in the market, you will see this happening over and over again.

There are two great lessons on the chart above. First, the pattern here is simply a sideways range bound pattern. We are not as concerned about the ‘entries’ to any long plays in this lesson as we are with where to ‘exit’. If you notice, there is a red line that stopped this stock four times in a row. That red line is the 200 period moving average. Note that it averages 200 periods (15 minute bars) on this chart. It is not a 200 ‘day’ moving average.
Moving averages serve several purposes. Smaller moving averages like the ‘8’ and the ‘20’ are fantastic guides to trend analysis. The 200 period moving average is more of a ‘wall’. Stocks tend to live on one side or the other of the 200 MA for a period of time. This can make them a form of ‘resistance’, even if it is a subjective one. This all applies equally to the concept of moving averages forming ‘support’ as well, but we will continue to discuss ‘resistance’, as it is demonstrated in the chart above. Here are a few rules to make sure you get the most out of them.
Notice on the chart above, that every rally died into the moving average and fell hard; except the last one. The rally to ‘4’ had a shallow pullback to ‘5’ and stayed above a newly rising 20 period moving average. This is your clue that the next attack of the moving average will break through. Not only will it break through, but it will often be a big breakout, as shown by the bullish wide range bar (+WRB) above.