VCM Weekly Trading Lessons
Why All Breakouts Are Not the Same
You may have noticed that sometimes when you play a breakout; it works quickly, easily, and moves so far so fast you can barely believe it. Then the next time, you find yourself stopped out, and the stock ‘never’ moves as you thought it would. Perhaps you have simply concluded that some plays work, and some don’t. While there is some truth to that, you may be missing important technical items that could give you a better idea of which breakouts should be played.
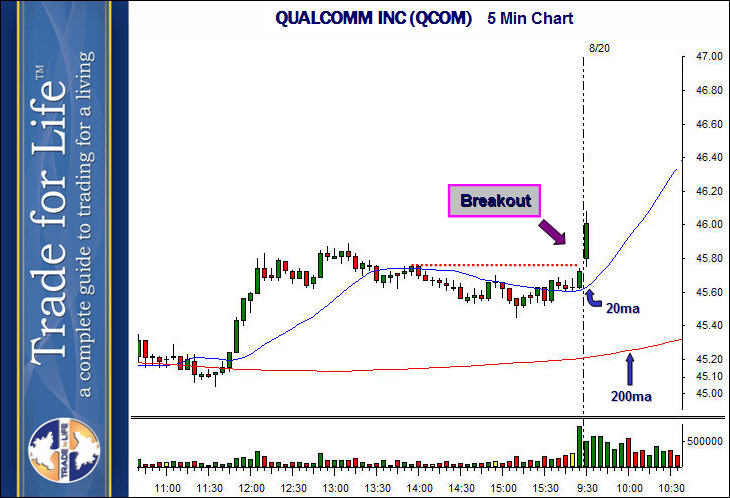
The focus of this article will be one simple but powerful point. Below is a five minute chart of QUALCOMM INC (QCOM). It is a breakout play, over a five minute consolidation.

We have an uptrend and then sideways consolidation. We see the breakout bar, as it clears all of the prior day’s base and all of this occurring above the rising 20 period moving average. Where did it go from there? Take a look below.
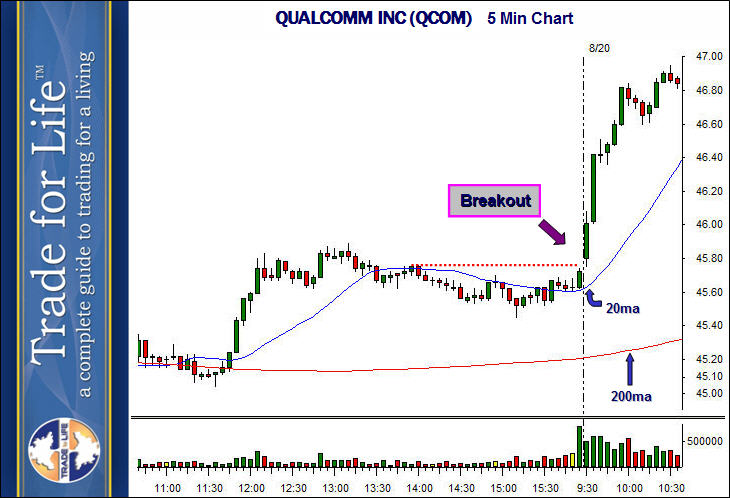
The break out was phenomenal. The rally continued and stayed strong on a big move right into the 10:30 reversal time. The stock stayed extended above the rising 20 period moving average and did not even care.
Let’s look at the same stock with a similar pattern. Once again, we have a breakout over a prior consolidation.
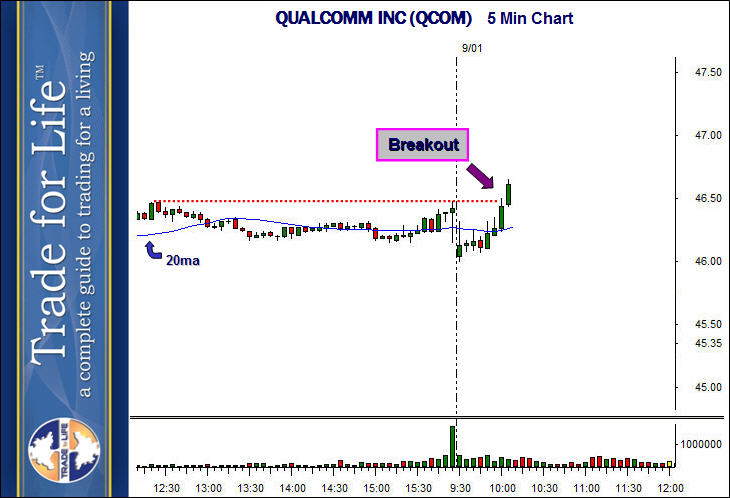
Like the prior setup, the breakout bar clears the entire prior day’s base, and is above the 20 period moving average. How did this very similar setup do? Take a look below.
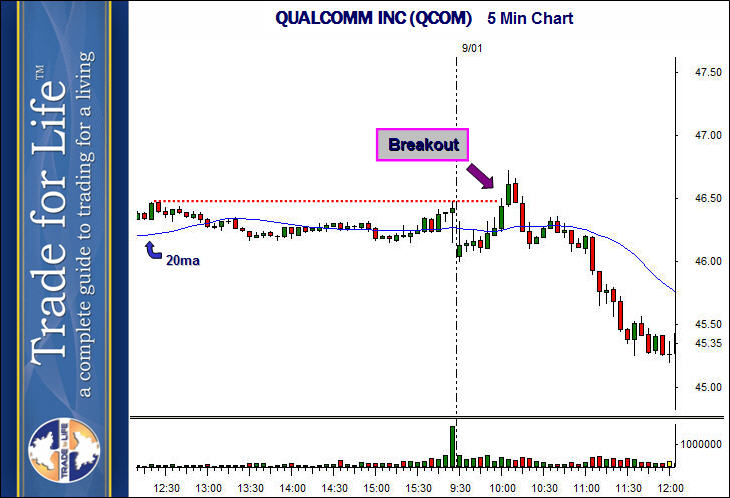
The breakout bar was the high of the day, and the stock came crashing down. It failed miserably and headed below the lows of recent day. How is it that two similar patterns reacted so differently? Do you see any differences that would have you knowing that the first play would run higher, while the second would crash to new lows?
You may see small differences in the size of the base, or the moving average, but these plays are very similar on the five minute chart you are looking at. Certainly, nothing that would separate and distinguish them based on the results of the move. So what is the difference? The different results could have been anticipated by looking at one more chart. While the five minute charts are similar, they exist inside bigger time frames. Take a look at the hourly chart below.
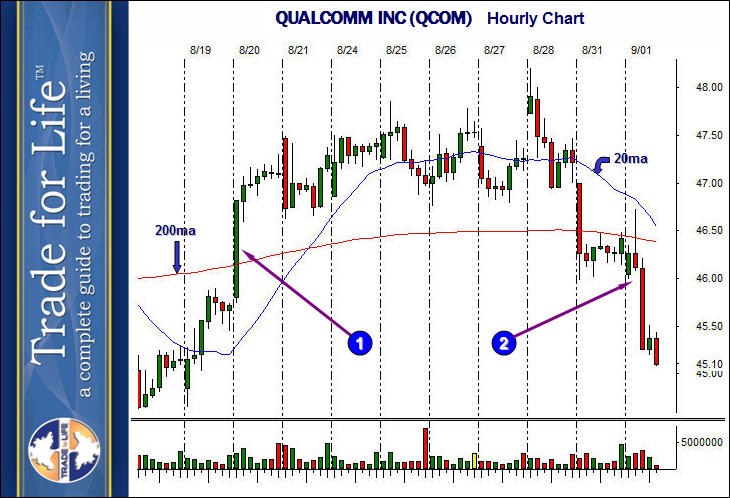
The first play (big winner) occurred approximately at ‘1’, and the second play (big loser) occurred at ‘2’. The first play occurred in a strong hourly uptrend that was well established. The second play occurred in an hourly downtrend that was also well established.
When playing long, having the bigger time frames in uptrends means the potential target is almost without limits. When playing long, having the bigger time frames in downtrends puts a ceiling above the play, and therefore would require a huge change in the nature of the stock to make a serious move. Always check the bigger time frames, and play with the bigger trend.