Weekly Trading Lessons
Absorbing Demand
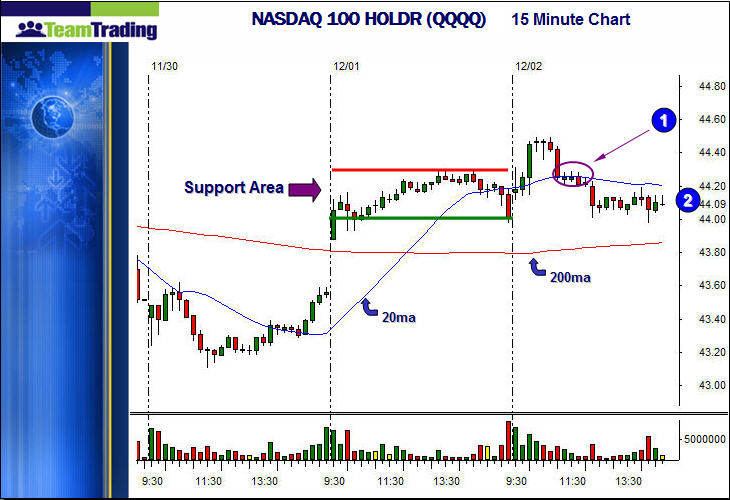
This is a slightly more advanced lesson on how you can get a reading on how stocks react to supply and demand. We always ‘expect’ stocks to act a certain way, based on our technical knowledge. However, the good technician knows how to read beyond what is ‘expected’. This is a chart, hot off the press, as this concept was discussed today at length in the Team Trading Proprietary Trading Room. Below is the 15 minute chart of the NASDAQ 100 HOLDR (QQQQ).

Let’s make a few observations about this chart. There are three trading days showing. It looks like we were in a downtrend on day one, and a rally at the end of the day may have ended that. Either way, the gap up the next day definitely did. The consolidation on day two was tight, and stayed mostly above the 20 period moving average (20ma). The end of the day shows a red bar into close, but it quickly reversed the next morning, and kept the market going higher, in a nice uptrend. The first pullback, in the circled area at ‘1’, initially was setting up a nice VCM buy setup. It is sitting on the minor support from the ‘top’ of the base from the prior day, and was right into the rising 20ma. There was just one problem. It went sideways for an hour (four 15 minute bars).
Now, there was nothing wrong with playing this buy setup when it triggered on the first or second bar. However, a couple bars later, there was a change happening. A support area (also called a demand area), is an area that has buyers available. These buyers are what make the stock bounce. The buyers are always in support areas. The question is, “how many sellers are there to ‘absorb’ the buyers”? If the buyers outnumber the sellers, at some point the stock moves up. If that demand is totally absorbed, the stock has no bounce, and there is nothing to support it, and no new momentum to attract new buyers.
Next, when a stock ‘flat lines’ on a support area, we know that all of those buyers are being counteracted by a large number of sellers. What happens is that the buyers in the support area make their buys, and start to run thin. The new stock owners in ‘1’, start to get discouraged because the stock is not moving, due to a large number of sellers. Note, these sellers are not normally there. This is why uptrends continue. However, we ‘know’ they are there in this case, because the stock does not move. If they out number the buyers from the base, the stock will not move up, and eventually, all of the ‘new’ buyers want out, as the stock has not moved in the correct direction. Eventually, these new buyers also become sellers, and a drop will occur to the next support level. This is what formed at ‘2’. This formed at the very bottom of the base, which was the last possible area for buyers. Again, no bounce means the last of the buyers are being absorbed, and unless something shocking happens to change things, the odds begin to favor the change of trend, to the downside.