VCM Weekly Trading Lessons
A Tool For Aggressive Traders
As new traders, we are all taught golden rules that make up many of the basics of trading. We usually proceed to ignore all those rules until the pain is so great that we reach down deep inside of ourselves to find the ‘real’ answers, the real rules we need to make money. After much hard work, more pain, and what seems like a long wait, traders usually wind up finding their own answers. Those answers always turn out to be exactly and precisely the ‘golden rules’ that were taught on day one. The traders just had to discover for themselves.
Eventually, successful traders develop their niche in the market. This is the ‘thing’ they love to do and they do it over and over again. When they do this, they may violate some of the traditional rules. The experienced trader can learn and manage plays that the novice should avoid. They can often do so, because they learn certain ‘tools’.
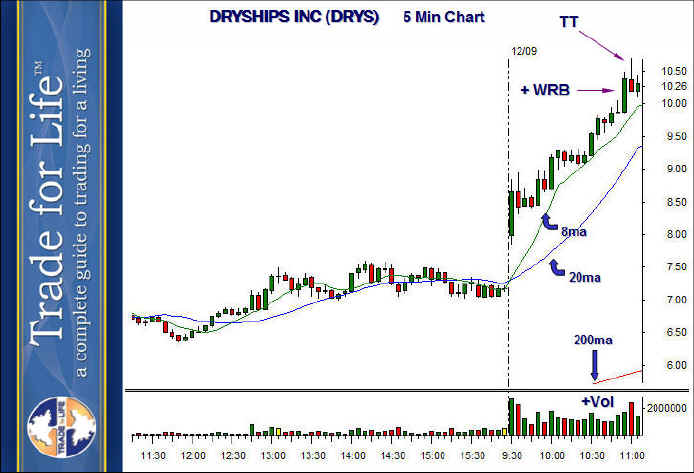
Below is a five minute chart of DRYSHIPS INC (DRYS). This play was done in the VCM Proprietary Trading Room, and was discussed as a very aggressive trade. The strategy was a climactic advanced sell (CAS). It is so aggressive; our earlier level traders are not allowed to play it. That is because this is the one strategy that fights the trend. Fighting the trend violates one of the first good rules you learn when trading. For a play like this, we sometimes use the term ‘mini CAS’ because it is not a ‘great’ set up. The problems lie in the fact that it is not ‘way’ extended from the 20 period moving average, and we also missed having five or more green bars by the one tiny red bar in the middle of the run.

We want to short this pattern, but there are a few problems. First, we know that trying to short this high as shown above is very unreliable. It looks easy once the chart is complete, but in real time, it is often difficult. Why didn’t the trader short three bars earlier? Or four? These would not have worked. Second, we need an entry with a tight stop because the second problem with this play is that the targets are often small. We are restricted to using a ‘retracement’ target. So playing the five minute chart above becomes unacceptable. We would be shorting under the red topping tail (TT) bar, with a stop over the top of that bar. This isn’t a bad entry, but the stop is wide, and we still don’t know the stock will continue to sell off just because the bar is red. After all, it did not sell off after other prior red bars.
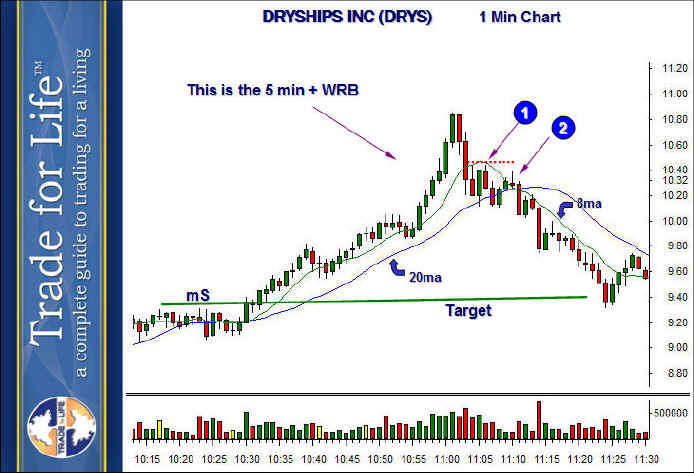
So what is the tool? What we want to do is short a red bar, that also contains the beginning of a change or trend on a smaller time frame. That will increase the odds of success. More important, it will give us a tighter and more precise stop. Below is the one minute chart that is expanding the area in questions, surrounding the high going into 11:00 o’clock.

On this chart, we see that there is additional information to learn. Look at the size of the one minute bars leading into the high. Compare them to the two prior rallies on the way up. When a stock is this ‘visually’ extended, then forms the biggest widest bars on the chart, you know it is almost ready. Since it is hard to catch the ‘top’ we wait for the buy set up to form at ‘1’. It is the ‘failure’ of that buy set up that is going to be out entry. That would be under the green bar at ‘1’. The best part is the stop. We will use the high of the rally formed by the alleged buy set up, which is where the red dotted line is. Why there? Because trading over that area will resume the one minute uptrend. We now only want to be in this trade as long as the one minute chart is downtrending.
After we enter, another rally forms a lower high at ‘2’. As this sell set up forms, we can now lower the stop to the topping tail at ‘2’, and aggressive traders may also add shares to take advantage of the lower stop amount.