VCM Weekly Trading Lessons
The Second Biggest Mistake
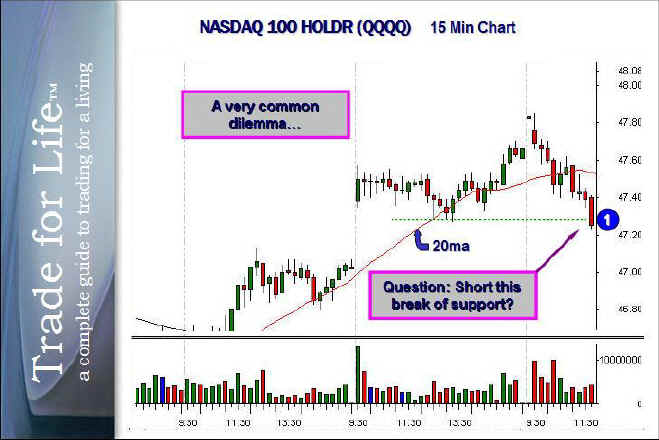
Today's lesson is going to be a very specific technical lesson that gets right to the point. It is about a question that comes up very frequently and can occur in any time frame. It is also what we consider to be the second greatest technical mistake made by most traders. The question and discussion will be regarding the chart below, and the possible short sale, based on the break of support at "1".

There are many good arguments to take this trade and certainly, to the beginning student, it is easy to understand why this trade will frequently be taken. The most common reason is simply that this stock is breaking a major support level (the green dotted line). It is trading below the low that was formed during the prior days trading and traders also see the big "void" below, to fill the gap. It is also a very large misconception by traders that gaps must be filled, so there is even a greater tendency to play this stock short as soon as the support levels are broken. So this chart is asking a very simple question. Should this stock be shorted as it breaks below the prior days low? The strategy would be based on a break of support, which is the break of the prior days low, with a void below to a target, i.e. the gap fill.
Since this article is titled, "The Second Greatest Mistake" you probably have figured that we feel the answer is no. The reason this is not a good trade is because there is more to a trade than just simply support and resistance. While these are very important items, many other considerations make up a good trade. For example, we have a rule about stocks only going three to five bars in one direction, before a correction is likely. It is a very high odds occurrence in the market. Notice that in this example, we have five lower highs in a row, preceding the break of support. In addition, if you count there are actually 9 out of 10 lower bars, leading into this break of support. It is never a good idea to short a multiple bar decline, just because it breaks the technical support number.
This brings us to the second issue. "Support" is not as simple as a single number. It is an area and is a concept, used to see how price handles a certain area. The fact that we have a wide range bar, after that many bars down into a general support “area”, means the stock is likely to bounce, not to fall more.

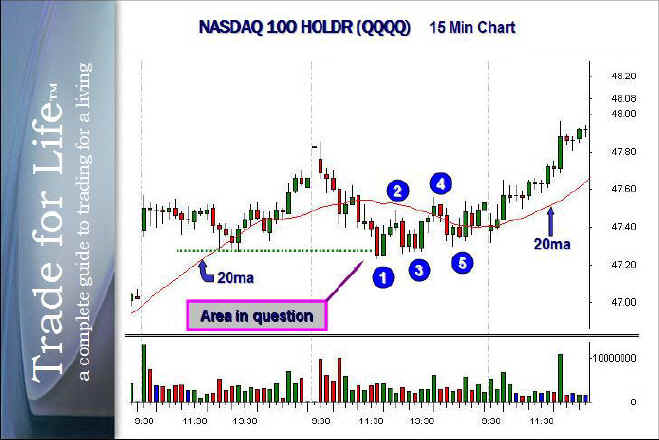
Above, you can see what actually happened to this stock. Naturally, it is easy for us to find charts to demonstrate anything we want to demonstrate. However, take a look at charts for yourself. See how many times you get away with shorting a stock that has the pattern above. Now it is not to say that this stock will never go lower. If other time frames indicate the stock might go lower, you should look to short the next rally. That is what would have occurred at "2". That entry would be a superior entry because it would have a tighter stop and you would be playing the stock after a rally to the declining 20 period moving average. Even if the stock did not go to new lows, it is possible that partial profits could have been taken on this trade as an intraday trade. Note in this particular case, a stock set a higher low at "3" and rallied to a higher high at "4". This actually changed the trend of this intraday pattern so that the next pullback to "5" was a buyable setup and the stock continued higher.
Remembering this ‘silver’ rule will save you money – remember it.