VCM Daily Trading Lessons
The TICK Indicator (TICK)
Today's Quote: “Data is not information, Information is not knowledge, Knowledge is not understanding, Understanding is not wisdom.” Cliff Stoll.
Wednesday we started talking about the Arms index, also known as the TRIN, a popular intraday market internal. Yesterday we took a deeper look at how to use the TRIN to help find turning points on the daily chart. Today we are going to look at how to use the TRIN on an intraday basis.
Let’s take a look at the SPY and the NYSE TRIN and how they can interact to make you money.

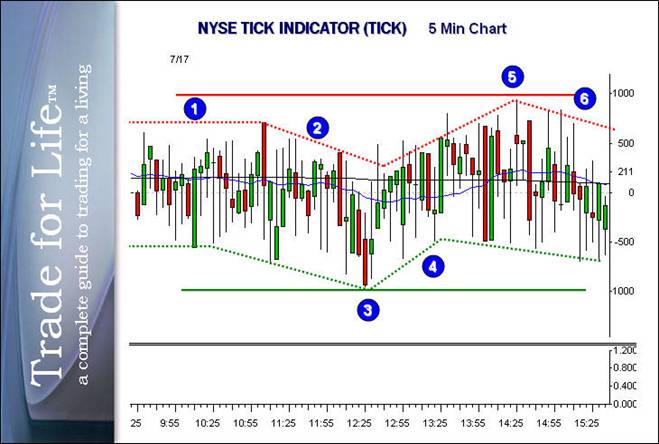
Above is a five minute chart of the TICK for the New York Stock Exchange. During the trading day we like to look at the TICK as we would any stock. We look at it on 5 and 15 minute charts with Japanese candlesticks. The only exception is that we don’t really need the 20 period moving average (or any moving average for that matter).
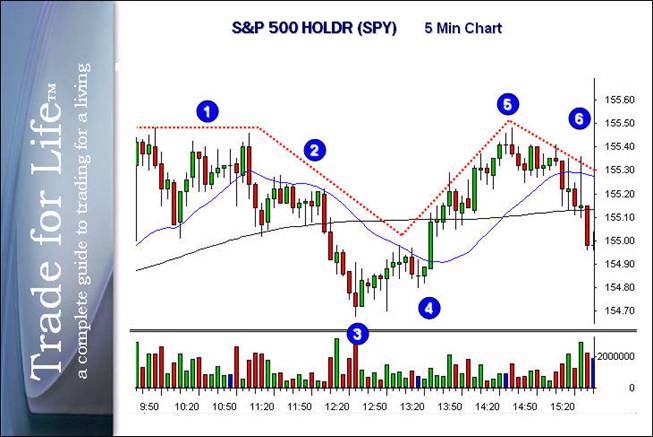
Note that there is some significance to the +1000 and -1000 areas on the TICK chart. We have drawn in solid red and green lines to represent these areas. The TICK is an oscillator and we use it by drawing references from the following events on the TICK chart. First of all we look for higher highs and higher lows as the individual bars form on the TICK. This would indicate a bullish market, the reverse would indicate a bearish market. Second we look at the absolute numbers and see if the center of the range is hovering above or below zero. Third we look to see when the extreme readings of +1000 and -1000 are reached. Take a look at the chart of the SPY below and see how well the TICK helped give us an insight to the market on this day.

Note at "1" the TICK has nearly equal highs and lows, and the center point of the range is almost perfectly at zero. The market also was continuing in a sideways fashion. During the period "2" we were making lower lows and lower highs on the TICK and the midpoint of the range began to slip way below zero. This only confirms what the market was doing and did not really give us any advance notice. However at "3" we reached -1000 and began making higher lows on the individual bars. That gave us advance warning of the low of the day and was an excellent point for long positions. During "4" we began a series of higher highs and higher lows and brought the average range up above zero again. Note that at "5" we hit the magic number on the top side of 1000. This set the high for the day and the lower highs and lower lows that followed carried the market lower into the end of the day.
The TICK is another useful market internal indicator that intraday traders should have in their view during the trading day.