VCM Daily Trading Lessons
The Arms Index (TRIN), Part 3 of 3
Today's Quote: “Opportunity is missed by most people because it is dressed in overalls, and looks like work." Thomas Alva Edison.
Wednesday we started talking about the Arms index, also known as the TRIN, a popular intraday market internal. Yesterday we took a deeper look at how to use the TRIN to help find turning points on the daily chart. Today we are going to look at how to use the TRIN on an intraday basis.
Let’s take a look at the SPY and the NYSE TRIN and how they can interact to make you money.

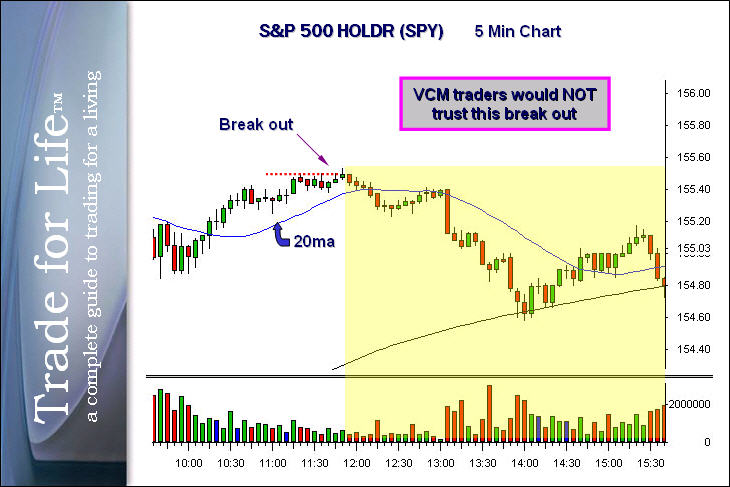
Above is a five minute chart of the SPY (tracking stock for the S&P 500). If you could for the moment, block out the part shaded in yellow and pretend you do not know where the market is going that day. We have a very bullish picture going into 11:45 a.m. We have an uptrend in the market moving up with higher highs and higher lows and sitting above a rising 20 period moving average. We are consolidating sideways into that moving average and at approximately 11:45 we broke above the base going to new intraday highs. What could be more bullish? VCM traders know that what could be more bullish would be to have the NYSE TRIN agreeing with the market at the time of the break out. Take a look at the chart below.

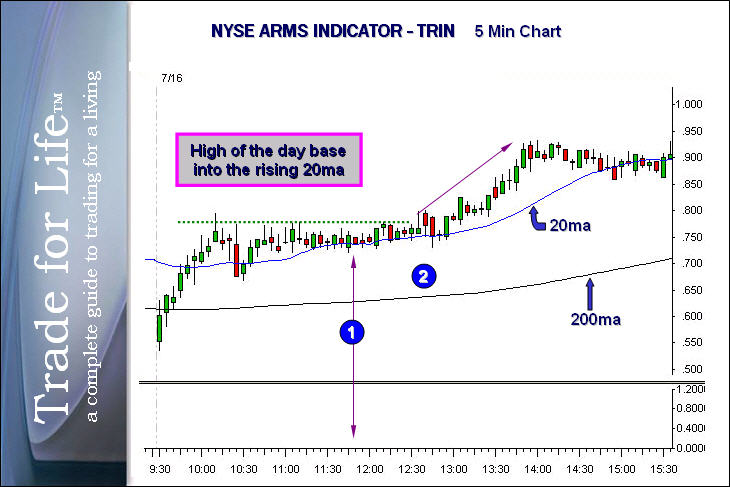
This is the New York Stock Exchange Arms Indicator, or the NYSE TRIN. Remember that this is an inverse indicator. The more bullish this particular chart pattern looks, the more bearish is for the market in general. Remember also that trading above 1.0 or an uptrend in the price pattern can be considered somewhat bearish. Trading below 1.0 or in a downtrend can be considered somewhat bullish. During the trading day we like to look at the TRIN as we would any stock. We look at it on 5 and 15 minute charts with Japanese candlesticks, with a 20 period moving average (200ma is also shown).
Notice that going into the 11 o'clock hour the trend was consolidating at the high of the day in an uptrend sitting above the rising 20 period moving average. This is all a very bullish chart pattern for this individual issue. However when the issue is the TRIN, it is very bearish for the market. It is rather unusual to find the conflict of both the market and the TRIN basing at the high of the day, both with similar bullish patterns. Also remember that this is happening going into lunch hour. Between the combination of low odds breakouts at lunchtime, and the high TRIN readings, this breakout was destined to fail.