VCM Daily Trading Lessons
The Arms Index (TRIN), Part 2 of 3
Today's Quote: “There is nothing which persevering effort and unceasing and diligent care can not accomplish.” Lucius Annaeus Seneca.
Monday we started talking about the Arms index, also known as the TRIN, a popular intraday market internal. It has uses both to the intraday trader and the swing trader. We looked at the formulas for the TRIN and some basic guidelines for what the numbers should be. Today we are going to take a deeper look at how to use the TRIN to help find bottoms on the daily chart. Tomorrow we will look at how to use the TRIN on an intraday basis.
The best way to look at the TRIN to help find turning points on the daily chart is to look at a chart of just the five and ten day moving averages of the TRIN, and compare that to the price pattern of the sector. Then note the support and resistance lines.

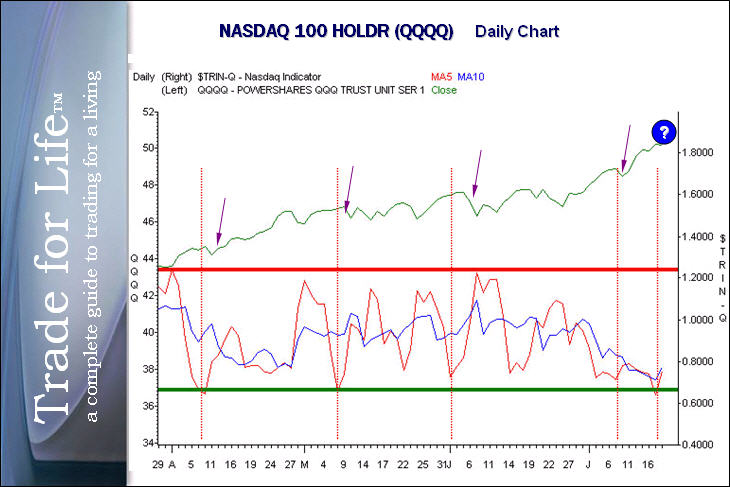
This is a sample chart of the NASDAQ 100 shown by the QQQQ and the five and ten day moving averages of the NASDAQ TRIN. During bullish times the TRIN will be under 1.0 most of the time. When the 10 day moving averages actually bring the TRIN to .8, it historically means we are near a high in price. When the TRIN reading brings the 10 day moving average to 1.2, it is high enough that the price is likely near a low. Naturally, like any internal reading, it is a clue to alert you when to take a price reversal may be happening. You always wait for the actual price reversal. While these numbers are the ‘guideline’ you always let the support and resistance form first. Every market may be a little different. Here, the support and resistance showed to be just a hair over 1.2 and a little below .7. The exceptionally low support number is due to the very bullish market shown by the QQQQ.
As you can see by the vertical red dotted line drawn in at every drop in the TRIN to the support line, the market dropped one to two days later. Not much in some cases. If you follow along you can see that when we hit resistance in the TRIN, the market rallied. The last day shown is coming off that support line. Here the TRIN is suggesting that the market shown is set to pullback for at least a couple of days. If the TRIN pops up to the 1.2 area, this market would be ready to move up again.